Nature and extent of gender segregation in Australia
2.1
The composition of Australia's workforce has changed substantially over
the past 40 years. As the Department of Employment noted in its submission:
[W]omen’s labour force participation rates have increased
from just under 45 per cent to almost 60 per cent. This increase has been
particularly prevalent among married females. By contrast, the proportion of
the adult male population participating in the labour force has been falling
from just under 80 per cent to about 70 per cent.[1]
Women’s increased workforce participation has not been
uniform across industries and occupations. Instead, women have been
concentrated into particular jobs and sectors. Where women do work side by side
with men, they are more likely to be working for them, as women find themselves
restricted to more junior or poorly paid roles.
2.2
The result is workplace gender segregation, with identifiable and
delineated zones of male and female workforce activity.
2.3
Workplace gender segregation is one of the most pervasive and persistent
aspects of contemporary global labour markets. Gender segregation is common to
most countries, even those with very different levels of economic development
and distributions of employment.[2]
2.4
In the mid-1980's, Australia had the most gender-segregated workforce in
the Organisation for Economic Co-operation and Development (OECD).[3]
Whilst Australia's ranking for gender segregation no longer exceeds that of the
United States and the United Kingdom, it remains high and is a persistent
trend.[4]
2.5
This chapter explores the nature and extent of gender segregation in
Australian workplaces.
Definition of gender segregation
2.6
Workplace gender segregation refers to the unequal distribution of women
and men in certain occupations or industries, or in organisational hierarchies.
It manifests itself in two distinct ways.
2.7
The Workplace Gender Equality Agency (WGEA) defines these dimensions as:
(Horizontal segregation is) under- or over-representation of
women and men in certain occupations or industries.
(Vertical segregation is) the imbalance between women and men
in leadership categories (occupational hierarchies)... men dominate leadership
categories while women are concentrated in non-management roles.[5]
Horizontal segregation in Australia
2.8
Horizontal gender segregation is deeply entrenched in the Australian labour
market, despite advances in female educational attainment, workforce
participation and legislation prohibiting discriminatory behaviours.[6]
2.9
Horizontal segregation is more resistant to change than vertical
segregation because it plays to our basic understandings of gender roles. Nurses
and teachers are often pictured as women, whereas doctors and lawyers are often
assumed to be men; these are visual examples of how highly engrained horizontal
segregation is in our society.[7]
2.10
In 2015 ̶ 16, six in 10 Australian employees worked in an industry
which is dominated by one gender. To put it another way, 60 per cent of
Australian workers don’t know what it is like to work in an industry with
balanced gender representation.
2.11
WGEA data in Figure 2.1 below shows that, between 1995 and 2015, there
have been some positive signs in certain industries, but there is no pattern of
desegregation in Australia across industries. Gender segregation remains a
significant feature. The WGEA data found that:
-
women are increasingly concentrated in two industries: Health
Care and Social Assistance, and Education and Training;
-
the proportion of women in male-dominated industries, including
Electricity, Gas, Water and Waste Services, and Transport increased; and
-
among the mixed industries, Public Administration and Safety,
Rental, Hiring and Real Estate Services, and Information Media and
Telecommunications in particular have become gender balanced.[8]
Figure 2.1—Proportion
of female employees by industry, 1995 and 2015
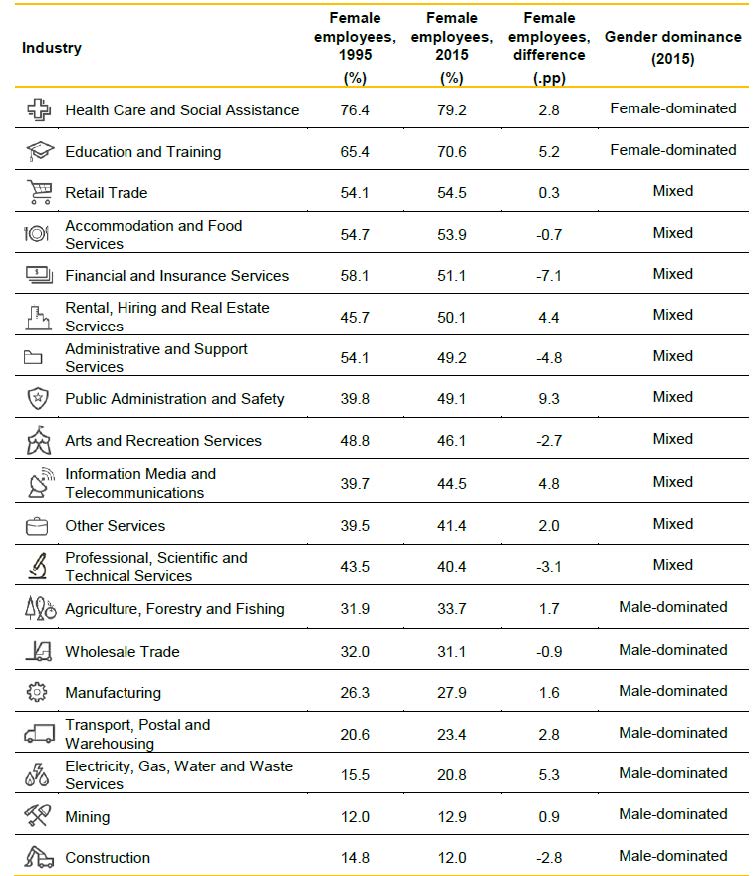
Source:
WGEA, Gender Segregation in Australia's Workforce, August 2016, p. 5.
2.12
In occupational segregation WGEA data shows that there has been little
change over the last two decades. Between 1995 and 2015, occupational gender
segregation remained consistent, as illustrated in Figure 2.2:
Figure 2.2—Proportion of
female employees by occupation, 1995 and 2015
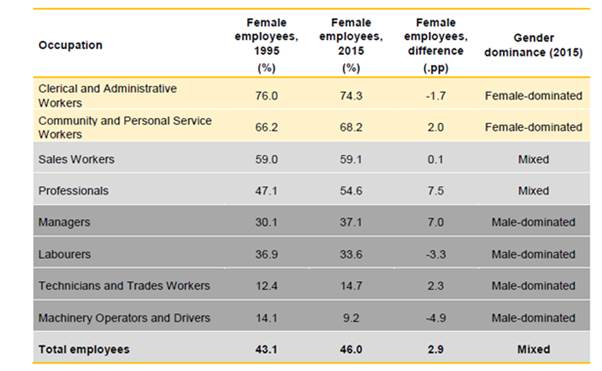
Source:
Australian Bureau of Statistics, Labour Force, Australia, detailed, quarterly,
May 2016, cat. No. 6291.0.55.003.[9]
2.13
Analysis by Work + Family Policy Roundtable (W+FPR) showed that, between
2006 and 2011, there was no substantial change in the feminisation rate of the
largest 20 occupational groups (comprising about 50 per cent of all employees).
2.14
These horizontal segregation trends are consistent with international
data. The International Monetary Fund (IMF) notes that women continue to be
highly over-represented in clerical, service, and professional occupations,
while men tend to be over-represented in craft, operator, and labourer jobs.[10]
The IMF notes that this was particularly prevalent across OECD countries:
Across the OECD membership, female employment is concentrated
in the services sector, which accounts for 80 percent of employed women,
compared to 60 percent for men. Within this sector, women fill a disproportionally
high share of occupations in health and community services, followed by
education.[11]
2.15
The International Labour Organisation’s (ILO's) report, Women at
Work: Trends 2016, shows that women tend to be over-represented in
the lowest paid occupations across both developed and developing nations (see
Figure 2.3 below):
Globally but in particular in developed countries, women are
highly represented in "Clerical, service and sales" occupations—where they even outnumber
men—and
"Elementary occupations". Both are typically associated with part-time
employment and low pay jobs.[12]
Figure 2.3—Occupational segregation,
142 countries (latest year available)
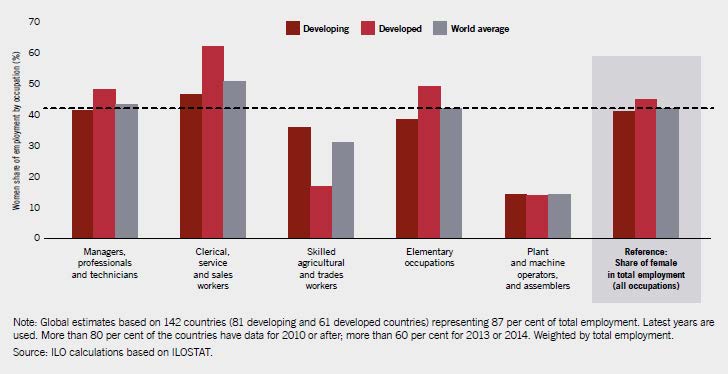
Source:
International Labour Organisation, Women at Work: Trends 2016, Geneva,
2016, Figure III, p. xiv.
2.16
The ILO reported that there has been no 'substantial decrease in
occupational segregation'.[13]
Researcher Dr Kirsti Rawstron, supported this finding and noted that, when
comparing occupational gender segregation of OECD nations from 1984–2010:
Overall, no single pattern of changing levels of sex
segregation is visible for all OECD countries. While some countries have shown
a decrease in the levels of sex segregation (whether significant or not),
others have shown an increase. What has emerged is a tendency for those
countries with already low levels of sex segregation to have displayed
decreasing sex segregation since 2000, while those with high levels of sex
segregation have generally shown an increasing trend.[14]
Vertical segregation in Australia
2.17
Vertical segregation primarily describes the under-representation of
women in senior positions. Data collected by WGEA indicates that the
representation of women steadily declines with seniority so that most senior
levels of management are heavily male-dominated. This means that men dominate
the senior levels of the occupation hierarchies across all industry groupings.[15]
2.18
WGEA data for 2015 ̶ 16 shows the proportion and number of female
Key Management Personnel (KMPs) and Chief Executive Officers (CEOs) in
non-public sector reporting organisations with 100 or more employees (see
Figure 2.4 below):
Figure 2.4—Proportion of
female KMPs and CEOs, WGEA data, 2015 ̶ 16
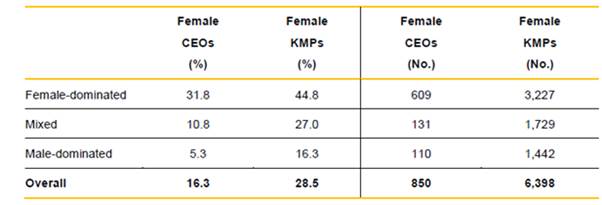
Source:
WGEA, Agency reporting data.
2.19
There is a clear relationship between horizontal and vertical
segregation. Research by Leanin.org and McKinsey & Company found that most CEOs
are promoted from line or operational roles rather than staff roles such as
Human Resources or Administration. Women are more likely to hold staff roles, and
this study found that their chances of being promoted to senior positions were significantly
reduced as a result. In the 2015 research, 90 per cent of CEOs were hired and
promoted from line roles, and 100 per cent of those were men.[16]
2.20
Findings by Bankwest Curtin Economics Centre (BCEC) show a linear relationship
between growth in the proportion of women in leadership positions, and a
decline in the gender pay gap.[17]
2.21
Although in practice very few individuals are appointed to executive
positions, vertical segregation at very senior levels can have an impact on the
welfare of larger groups of women. Companies with few female executives had a
higher pay gap than those with an equal share of women and men. Conversely,
those that increased the share of female executives reduced their pay gap by up
to three percentage points:
The strength of association between pay equity and women in
leadership could reflect more the cultures and attitudes towards gender
diversity embedded within companies—these
cultures and attitudes vary according to their industry sector, scale and
organizational setting. Companies with a positive attitude to gender diversity
are likely to drive equity both in pay and in the progression of women into
leadership positions, leading to a strong correlation between the two
indicators.[18]
Measuring gender segregation
2.22
The quality and extent of Australia's gender data is widely acknowledged
to be amongst the best in the world. Several witnesses testified to the
importance of the various datasets available to policymakers, employers and
employees in understanding the nature and extent of gender segregation and the
pay gap in Australia's workplaces.[19]
Key sources of gender data
2.23
The Australian Government's WGEA dataset was a key source of data for
submissions to this inquiry, providing the basis for analysis of the nature and
extent of gender segregation and the pay gap in Australia. BCEC described it as
'unique and world-leading'.[20]
2.24
The Workplace Gender Equality Act 2012 requires non-public sector
employers with 100 or more employees to annually report to the WGEA under six
gender equality indicators, generating a standardised performance assessment
that enables comparisons across industries and organisation sizes.
2.25
Reporting organisations also indicate whether they have conducted a
gender pay gap analysis, and what actions have been taken to address gaps. WGEA
provides reporting organisations with customised, confidential benchmark
reports enabling employers to track their progress in reducing any gaps and how
they compare with other employers.
2.26
The inquiry found that the process of reporting to WGEA can be an
illuminating for employers, as it can reveal previously unrecognised gender pay
gaps. Women in Super (WiS), for example, noted that some universities were
'extremely shocked' to discover how pay differences had crept into their
remuneration packages, even though they had publicised pay scales, as a result
of bonuses and other additional benefits negotiated by individual male employees.[21]
2.27
WiS noted that their own industry (financial services) has one of the
highest gender pay gaps, yet there is little understanding of the nature and
extent of the pay gap:
You are talking about an industry here that should know its
numbers inside out and upside down, yet it still has an extremely high pay gap.
We have to collect this data, we have to analyse it and we have to have the
discussions.[22]
2.28
BCEC noted that there are several other valuable gender-related datasets
available to Australian policymakers, including the Household, Income and
Labour Dynamics in Australia (HILDA) Survey conducted by The University of
Melbourne, the Australian Bureau of Statistics (ABS) Gender Indicators, and the
Australian Census datasets.
2.29
However, it was noted that there is currently a gap in the data sources that
'limits our capacity to really identify all aspects of gender segregation'.[23]
BCEC recommended that resources be made available to improve portability
between datasets of employer information (such as those collected by WGEA) and employee
information (such as those collected by HILDA).[24]
2.30
W+FPR pointed to the need for revisions to current data collection
protocols, to allow for increased granularity of occupational categories. It
was noted that the standard format in the Australian and New Zealand Standard
Classification of Occupations typically groups all professionals together. More
finely grained data would enable researchers to 'cut through some of the tiering
that occurs within the professional group':
There is a requirement for datasets that take into account a
very finely grained occupational detail, so what we would think of as at least
three-digit occupational data, and be able to able to meld that successfully
with industry segregation as well...this would address some of the contest in the
literature concerning the impact of occupational segregation.[25]
2.31
W+FPR noted that, whilst some datasets such as HILDA offer more detail,
there is still a need for coherent datasets to work at a more finely grained
level and be able to address different types of gender segregation.[26]
2.32
The National Foundation for Australian Women (NFAW) observed that the
discontinuation of the Australian Bureau of Statistics Time Use study had
created a significant gap in the available datasets relevant to this subject.
It was described as:
...a vital record of women’s work. It provided accurate data
concerning the extent and distribution of unpaid work and its intersection with
paid work.[27]
2.33
The NFAW recommended that the regular undertaking of the Time Use Survey
recommence.[28]
Transparency of reported pay gap
and segregation information
2.34
Currently, data reported to WGEA is only published on an anonymous
basis, and aggregated and analysed by occupation, industry, seniority and other
dimensions. Some witnesses raised the issue of the transparency and
accessibility of gender data.
2.35
The United Kingdom recently decided to extend its existing gender data
reporting model, to require all employers with 250 or more employees to publish
and report figures about their annual gender pay gap, together with a
'supporting narrative' to explain why the gap is present and what the
organisation intends to do to close it.[29]
2.36
W+FPR argued that the current WGEA gender equality reporting
requirements could be expanded along the lines of the UK model:
Further to the policy measures and in addition to the current
annual gender equality reporting to WGEA, we submit that there are advantages
in the public reporting of individual employer's gender pay gaps. A scheme
could be devised that would allow employers to accompany their gender pay gap
data with an explanation of why a gap exists and their action plans to overcome
it.[30]
2.37
This view was not shared by all witnesses. Ai Group argued that the
current reporting system is working well and that no further increase in the
level of mandatory reporting by employers is necessary.[31]
2.38
At the company level, it was noted that new provisions to achieve transparency
of individual remuneration could support gender equity, because pay secrecy
obscures the relationship between pay and performance.
2.39
Victorian Women Lawyers recommended removing pay confidentiality clauses
from new employment contracts and enterprise agreements.[32]
2.40
Level Medicine recommended introducing pay auditing or disclosure of
salaries in organisations employing doctors to draw attention to pay gaps where
they exist.[33]
2.41
The Shop, Distributive and Allied Employees' Association (SDA)
recommended that the Workplace Gender Equality (Minimum Standards)
Instrument 2014 be amended to require companies to report the base salary
and total remuneration for all levels, including CEOs.[34]
2.42
PROGRAMMED, which employs 20,000 staff in maintenance and facility
management, undertakes annual pay equity reviews and has reduced the pay equity
gap from 26 per cent in 2013 ̶ 14 to 17.8 per cent in 2015 ̶ 16 (the
gap is 23.1 per cent Australia-wide).[35]
Conclusion
2.43
The committee accepts the evidence that Australian gender segregation is
significant, and that high rates of industrial and occupational segregation are
associated with high rates of vertical segregation and gender pay gaps.
Navigation: Previous Page | Contents | Next Page