Chapter 4
The impact of income inequality on disadvantaged groups
Introduction
4.1
This chapter responds to the inquiry's fourth term of reference relating
to the impact of income inequality on disadvantaged groups within the
community. These groups include Aboriginal and Torres Strait Islander
peoples, older job seekers, people living with a disability or mental illness,
refugees, single parents and women. These groups are vulnerable to poverty for
reasons that will be discussed. They are typically among the lowest income
earners in society and disproportionately represented among social security
recipients and public housing tenants.
4.2
This chapter focusses on the impact of low incomes on people within
these disadvantaged groups. The committee has had the opportunity to gather
evidence from various stakeholders on the underlying vulnerability of these
groups to poverty. No or low income among these vulnerable groups often acts to
entrench their disadvantage.
4.3
The chapter identifies the disadvantaged groups and the evidence of
their disadvantage. It notes:
-
the underlying disadvantage and discrimination that is faced by
people in these groups;
-
how this disadvantage contributes to their economic exclusion;
and
-
the impact of a low income or welfare dependency on a person's
housing, health, education and labour market opportunities.
The chapter concludes by noting that there are other
factors—such as geographic disadvantage and the nature of labour markets—that are
often experienced by people in these groups which serve to compound their
disadvantage.
Disadvantaged groups
4.4
Some groups in Australian society are more vulnerable to poverty and
disadvantage than others. This includes Aboriginal and Torres Strait Islander
peoples, people with disability, people living with a mental illness, single
parents and newly arrived migrants (particularly those without English). For people
in these groups, a low income is typically a symptom of more fundamental
disadvantages that they face in everyday life. However, income is a key factor
in determining the economic wellbeing of these groups. In the absence of an
income or transfer payments to sustain a basic standard of living, a person's
physical and mental health often deteriorates and their capacity to enter or
re-enter the workforce and engage in community activities is diminished.[1]
4.5
There have been several research studies, over a considerable period of time,
which highlight the over-representation of these groups among the poorest in
society. They are over-represented among low income earners, welfare
recipients, the unemployed, the poorly educated and those living in public
housing. The combined effects of an established illness and a low income
mean that the health outcomes of many members of these groups tend to worse
than for the general population. As Dr Matt Fisher of the Southgate
Institute for Health, Society and Equity at Flinders University told the
committee:
People in the disadvantaged groups named in the terms of
reference are among those most likely in Australia to undergo both negative
material and psycho-social effects of low income, contributing to their
disproportionately high levels of chronic illness and shorter lifespans. An established
illness, of course, is also likely to impact on income by being a barrier to
employment, or through the costs of medicines.[2]
4.6
It is also important to remember that many Australians fall within multiple
disadvantaged groups. For example, in 2008, 41 per cent of young Aboriginal
parents were single parents.[3]
Refugees will often suffer mental health issues due to pre- and post-migration
experiences.[4]
Aboriginal and Torres Strait
Islander peoples
4.7
Multiple studies over the past 40 years have highlighted the severe and
endemic nature of Aboriginal disadvantage in Australia.[5]
They have found that an Aboriginal person is not only more likely than a non-Aboriginal
and Torres Strait Islander Australians to have a lower income, but is also more
likely to:
-
have poorer health;
-
a lower level of education;
-
be homeless;
-
be incarcerated;
-
commit suicide; and
-
have a lower life expectancy.[6]
Income inequality and Aboriginal
and Torres Strait Islander peoples
4.8
The majority of Aboriginal and Torres Strait Islander people have a low
income. The 2011 Census found that:
-
fifty-two per cent of Aboriginal and Torres Strait Islander
people aged 15 years and over reported a personal income between $1 and
$599 per week, compared with 32 per cent of the Australian population;[7]
and
-
13 per cent of Aboriginal and Torres Strait Islander people aged
15 years and over reported a gross personal income of $1 000 or more per week
compared with 33 per cent of the non-Aboriginal and Torres Strait Islander
people population.[8]
4.9
The Productivity Commission's November 2014 Key Indicators report
noted that:
The proportion of adults whose main income was from
employment increased from 32 per cent in 2002 to 41 per cent in 2012–13, with a
corresponding decrease in the proportion on income support. Increasing
proportions of employed people were in full time and managerial positions.
After adjusting for inflation, median real equivalised gross
weekly household (EGWH) income for Aboriginal and Torres Strait Islander
Australians increased from $385 in 2002 to $492 in 2008, but did not change
significantly between 2008 and 2012–13 ($465). In 2011–12, non-Indigenous median
EGWH income was $869.[9]
'Closing the Gap'
4.10
Income inequality is just one of a number of intersecting inequalities
that have combined to create the severe poverty faced by Aboriginal Australians.[10]
The current focus of Australian Governments is to reduce the level of Aboriginal
and Torres Strait Islander peoples disadvantage across a number of key
indicators. The 2014 Closing the Gap report found that progress towards reaching
targets on these indicators had been mixed. It noted that:
-
in 2010–12, Aboriginal and Torres Strait Islander peoples life
expectancy was 69.1 years for males and 73.7 for females. In 2014, the
Australian Bureau of Statistics (ABS) reported that life expectancy for the
Australian population was 80.5 for males and 84.6 for females.[11]
The report commented that 'progress will need to accelerate considerably if the
gap is to be closed by 2031';
-
in 2012, 88 per cent of Aboriginal and Torres Strait Islander children
in remote areas were enrolled in a pre-school programme. The benchmark is
95 per cent;
-
in terms of reading, writing and numeracy, 'only two out of eight
areas have shown a significant improvement since 2008'; and
-
'no progress has been made against the target to halve the
employment gap within a decade' (by 2018).[12]
Employment, unemployment and
exclusion from the labour force
4.11
Unemployment and exclusion from the labour force is clearly a
significant factor in the relatively lower incomes received by Aboriginal and Torres
Strait Islander peoples people. The 2011 Census found that only 46.2 per cent
of Aboriginal and Torres Strait Islander people were employed, compared with
72.2 per cent of non‑Aboriginal and Torres Strait Islander people. The Aboriginal
and Torres Strait Islander people unemployment rate (9.6 per cent) was more
than double the rate for non-Aboriginal and Torres Strait Islander people (4.2
per cent).[13]
The proportion of Aboriginal and Torres Strait Islander people not in the
labour force (ie: neither employed nor unemployed) was 46.2 per cent compared
with 23.6 per cent among the non-Aboriginal and Torres Strait Islander people population.[14]
4.12
The 2014 Closing the Gap report cited employment data from the
Australian Aboriginal and Torres Strait Islander Health Survey (AATSIHS)
suggesting the proportion of Aboriginal and Torres Strait Islander people
employed fell from 53.8 per cent in 2008 to 47.8 per cent in
2012–13. The report did caution:
Some care is required in assessing progress on this target as
the Australian Bureau of Statistics (ABS) counts participants in Community
Development Employment Projects (CDEP) as being employed. The policy goal is to
increase mainstream (non-CDEP) employment not the number of CDEP
participants–CDEP is not intended to be a substitute for mainstream employment.
There has been a large fall in the number of CDEP
participants from 2008 to 2012–13, which accounts for more than 60 per cent of
the decline in the Aboriginal and Torres Strait Islander people employment rate
over this period. The Aboriginal and Torres Strait Islander people mainstream
(non‑CDEP) employment rate also fell from 48.2 per cent in 2008 to 45.9
per cent in 2012–13. However, this fall was not statistically significant.[15]
4.13
The 2014 Closing the Gap report also noted AATSIHS data that only
30.2 per cent of Aboriginal and Torres Strait Islander adults aged
15–64 in very remote areas were employed in a mainstream job in 2012–13
compared to 51.4 per cent in inner regional areas.[16]
4.14
In the 2011 Census, Queensland recorded the highest unemployment rate
among Aboriginal and Torres Strait Islander peoples of any Australian
jurisdiction.[17]
The Aboriginal and Torres Strait Islander peoples unemployment rate in
Queensland was 19.5 per cent compared with the State's non-Aboriginal
and Torres Strait Islander peoples rate of 6.0 per cent. Ms Catherine
Bartolo, Chief Executive of YFS Limited, told the committee that literacy
and numeracy remain barriers to employment for Aboriginal and Torres Strait
Islander peoples in Queensland. She also noted that the Queensland Government
no longer provides programs to assist people to develop the social skills to
obtain a job.[18]
Community Development Employment
Projects
4.15
The CDEP was an Australian Government funded initiative for unemployed Aboriginal
and Torres Strait Islander people living in particular locations. The CDEP
offered paid (minimum wage) opportunities for Aboriginal and Torres Strait
Islander participants to improve their work skills with the aim of securing
long term employment.
4.16
Introduced in 1977, the CDEP has been reformed and tightened over the
past decade with participant numbers currently less than a third of what they
were a decade ago. The current government's focus is on paid work for Aboriginal
and Torres Strait Islander people:
Our next priority is getting people into real jobs. Too
often, employment and training programmes provide ‘training for training’s
sake’ without delivering the practical skills people need to get real jobs.
The Government has commissioned a review of employment and
training programmes led by Mr Andrew Forrest. This review will provide
recommendations to make Aboriginal and Torres Strait Islander peoples training
and employment services better targeted and administered to connect unemployed Aboriginal
and Torres Strait Islander people with real and sustainable jobs.[19]
4.17
On 1 July 2013, the CDEP was integrated into the Remote Jobs and
Communities Programme (RJCP). As of 30 June 2014, the RJCP replaced the CDEP in
remote regions of Australia. CDEP participants are being transitioned to
mainstream employment services and CDEP wages have been replaced by income
support payments.[20]
4.18
The committee received evidence that the CDEP has not been evaluated on
the basis of its original objectives of cultural preservation and community
building. Associate Professor Michael Dockery of the Bankwest Curtin Economics
Centre told the committee:
...the CDEP was put in place because of a recognition that
people were living in remote areas where there was no labour market, so it was
silly to talk about: 'We've got to get people into jobs.' The CDEP was brought
in originally as an alternative to sit-down money. When you go back and look at
the program—it came in with the Aboriginal employment development program
following the Miller report in the 1980s—the objectives of the program were
explicitly community capacity building, cultural preservation and all those
nice words about building community and culture and capacity.
Over the years, when they were evaluated, those objectives
were just completely ignored. I have never seen a single measure...of: 'Well, did
we build community capacity? Did we promote cultural preservation, cultural
strengthening?' The objectives of those programs were completely ignored. In
the CDEP, there is a review every year; there are about 15 of them...
They more and more focus on, 'Did we get them into mainstream
employment?' And this is in the middle of the desert, where there are no jobs...
The whole objective was ignored. It is now assumed that this
was a failure, without a proper evaluation, in my view. One of the reports
criticised CDEP because it found people were happy on CDEP. It said: 'We can't
have people happy. They should be really unhappy and wanting to get into a
mainstream job.'[21]
Homelessness among Aboriginal and
Torres Strait Islander people
4.19
One-quarter of homeless Australians are Aboriginal. The 2011 Census
found that there were 105 237 homeless people in Australia of which 26 744
were Aboriginal or Torres Strait Islander people.[22]
The November 2014 Key Indicators report stated:
Aboriginal and Torres Strait Islander people are
overrepresented amongst those who received assistance from specialist
homelessness agencies. Although only representing 3 per cent of the Australian
population in 2011, Aboriginal and Torres Strait Islander people represented
around one-fifth (22 per cent) of [specialist homelessness services] SHS
clients (AIHW 2013). However, Aboriginal and Torres Strait Islander people and
non‑Indigenous people sought services for similar reasons.
In 2012-13, domestic/family violence was the second most
common main reason both Aboriginal and Torres Strait Islander and
non-Indigenous people sought SHS (24.0 per cent and 22.4 per cent
respectively), after accommodation difficulties (30.6 per cent and 30.1
per cent respectively). For both Aboriginal and Torres Strait Islander and non‑Indigenous
SHS clients, the proportion for whom domestic/family violence was the main
reason for seeking assistance increased as remoteness increased (17.0 per cent
and 19.4 per cent respectively in major cities compared to 45.0 per cent and
55.3 per cent respectively in very remote areas).[23]
4.20
The committee heard that Aboriginal people from remote areas can find it
difficult to adapt to living in an urban environments. Professor Daphne Habibis
of the University of Tasmania told the committee:
It is very well established that when Aboriginal people move
from remote communities into larger population centres they are very vulnerable
to homelessness. There is to some extent a culturally-sanctioned norm of living
in open spaces, but that comes with very high health costs if they do that for
any length of time. They are also exposed to environments of access to drugs
and alcohol, which can be very damaging for them. They may not have the money
to return home, so providing ways to support people who move to large
population centres is very important but it is also providing avenues for them
to return home if they are not living in an appropriate environment in the city
centres.[24]
Incarceration
4.21
At 30 June 2013, there were 8,430 prisoners who identified as Aboriginal
and Torres Strait Islander. This represented just over one quarter (27 per cent)
of the total prisoner population (30 775).[25]
The age standardised imprisonment rate for Aboriginal and Torres Strait
Islander prisoners at 30 June 2013 was 1,959 Aboriginal and Torres Strait
Islander prisoners per 100 000 adult Aboriginal and Torres Strait Islander
population. The equivalent rate for non-Aboriginal and Torres Strait Islander prisoners
was 131 non-Aboriginal and Torres Strait Islander prisoners per 100 000
adult non‑Aboriginal and Torres Strait Islander population.[26]
Recidivism
4.22
The rates of recidivism among Aboriginal and Torres Strait Islander prisoners,
both adult and juvenile, are significantly higher than those for non-Aboriginal
and Torres Strait Islander prisoners. Figure 4.1 is drawn from the November
2014 Key Indicators report. With reference to the figure, the report
observed:
Nationally, 77.0 per cent of Aboriginal and Torres Strait
Islander prisoners on 30 June 2013 had a known prior imprisonment, with this
proportion remaining relatively unchanged over the past 13 years. The
proportion of non-Indigenous prisoners with known prior imprisonment was
50.9 per cent, also relatively unchanged over time...
Nationally, 77.9 per cent of Aboriginal and Torres Strait
Islander male prisoners had experienced prior adult imprisonment, compared with
67.8 per cent of Aboriginal and Torres Strait Islander female prisoners.
The proportion was higher for Aboriginal and Torres Strait Islander male
prisoners compared with non-Indigenous male prisoners (except in the ACT) and
Aboriginal and Torres Strait Islander female prisoners compared with non-Indigenous
female prisoners (except in Tasmania).
Figure 4.1: Proportion of prisoners with known prior adult imprisonment
under sentence, by sex, 30 June 2013

Aboriginal and Torres Strait
Islander peoples education and training
4.23
Aboriginal and Torres Strait Islander people have lower levels of
education compared to non-Aboriginal and Torres Strait Islander Australians. A
recent Australian Institute of Health and Welfare report found that in 2011, 26
per cent of Aboriginal and Torres Strait Islander Australians aged 15 years
and over completed a non-school qualification compared to 49 per cent of non-Aboriginal
and Torres Strait Islander Australians.[27]
4.24
School retention rates are also significantly lower for Aboriginal and
Torres Strait Islander peoples people than for non-Aboriginal and Torres Strait
Islander peoples Australians. The federal government has stated:
Getting children to school is the Australian Government’s
number one priority in Aboriginal and Torres Strait Islander peoples Affairs.
Poor attendance means that Aboriginal and Torres Strait Islander children
find it hard to perform at school. We must break the cycle of non‑attendance
to ensure today’s kids are educated and equipped to become future leaders in
their communities.[28]
4.25
In 2013, there were around 180 000 Aboriginal and Torres Strait
Islander students attending school full-time. The majority of these students
attended a public school. In 2013, the national apparent retention rate for
Year 7/8 to Year 12 Aboriginal and Torres Strait Islander students was 55.1 per
cent compared with 82.9 per cent for all other students. Nonetheless, the Aboriginal
and Torres Strait Islander school retention rate has increased significantly,
up from 39.1 per cent in 2003.[29]
4.26
The committee did hear of positive outcomes in terms of both retention
rates and Aboriginal education programs. Ms Anne Hampshire of The Smith Family highlighted
the achievements of two such programs:
We are running a more intensive form of our scholarship
program in Centralian Middle School in Alice Springs. It is initially focused
on Aboriginal girls, but it is a mixed program because the Aboriginal community
wanted it to be a mixed program. There is very little in the Aboriginal girls'
space in terms of programs. There is a 12 per cent difference in attendance
rates for Aboriginal girls on the program compared to Aboriginal girls in the
school not on the program. It is more intensive, so our ratio is three
coaches—we call them 'coaches' deliberately—for 25 students. There is a
whole wraparound support, experiential trips, breakfast with a mentor, regular
activities and regular touch points for the girl and their family in the
context of a supportive school environment. We have a 12 per cent
difference in the attendance rates...
Learning For Life is well established as well. We have been
doing much more refined work around the outcomes. Our Aboriginal attendance
rates on our Learning for Life scholarship are 86 per cent. So our average
attendance rates are higher than national Aboriginal attendance rates
generally. Our average primary attendance rates are 90.4. So these are very
consistent good figures, but we are obviously working harder to increase them
again.[30]
4.27
At the public hearing in Hobart, the committee took evidence from the
Youth Network of Tasmania. The Network's Chief Executive Officer, Ms Joanna
Siejka, highlighted the success of a case-management approach:
Youth Connections is a really effective service working with
young people who are either completely disengaged from schooling, from the
workplace and from family right across the board—no connections whatsoever—or
have some connections. It provides case management support to assist them to
work out what their pathway will be and to support them to maintain that. They
are very, very high risk clients. It has a very high rate of success with young
people of Aboriginal and Torres Strait background.[31]
4.28
At the public hearing in Rockingham, Mr Craig Comrie of the Youth
Affairs Council of Western Australia, drew the committee's attention to some
significant initiatives in the State to equip and support Aboriginal and Torres
Strait Islander peoples young people to enter the workforce or education. As he
told the committee:
I want to mention in particular the ICEA Foundation, run by
Lachie Cooke, and the Australian Aboriginal and Torres Strait Islander peoples
Mentoring Experience—AIME—where young people are trying to tackle issues in
local communities for Aboriginal people. It is actually young people who are
taking the leadership role and saying, 'We want something better in our
communities. We want something better for young people.' The main thing that
those two programs are doing that I think is having great success is focusing
on providing young people with mentors and role models that they can actually
have in their lives who are potentially successful in their area of expertise.
Providing them with someone that they can aspire to be is something that I
think we need to be looking more at. The energy of these organisations is
unmatched by many others. Seeing young people driving the agenda is something
we need to be encouraging more.[32]
4.29
At the same hearing, Mr Sameh Gowegati, the Chief Executive Officer of
the South Metropolitan Youth Link Inc. (SMYL), noted the progress that had been
made in Western Australia on Aboriginal and Torres Strait Islander peoples
school retention rates. He told the committee:
When we started our Aboriginal schools program in 1997, 18
per cent of Aboriginal kids in WA got to year 12. That was a disgrace. It was
not such a huge problem in 1997 because you could get a job with a year 10
qualification. By the time we got to 2000, you could not get into TAFE with a
year 10 qualification and the jobs were shrinking, so we had to come up with a
solution. The schools program basically got those kids into employment and
training with a host employer for a day a week, and they were staying at school
and doing a day at TAFE. We played around with it and tried to create a pathway
for Aboriginal kids. That program was successful. By 2008 we had in WA achieved
a completion rate of year 12 for Aboriginal kids of 52 per cent based primarily
on that program. So we had raised the retention rate of Aboriginal kids to year
12 from 18 per cent to 52 per cent by 2008. Commensurate with that, we have
provided about 3,000 Aboriginal kids with apprenticeships, traineeships and
jobs. These were kids who otherwise would not have participated and so
that, probably more than anything else in this region, had a fundamentally huge
impact on addressing that huge gap between Aboriginal poverty, equality and
everything else.[33]
4.30
However, Mr Gowegati expressed regret that retention levels had since
fallen in the state, in part because of a lack of commitment and structure to
funding programs. In terms of the SMYL program, he explained that:
The federal government pulled its funding out. The state
government decided that it would focus on excellence, not equity, and so it
basically damned the program. As a trainer, we kept it alive. We kept funding
it ourselves, but the numbers dropped. So instead of having 400 to 500
Aboriginal kids every year staying at school and completing year 12, the numbers
dropped down to about 180 that we could fund ourselves.[34]
4.31
The committee was interested in SMYL's role of identifying Aboriginal
children at risk of falling out of the mainstream education system and giving
them training on a wage. Mr Gowegati told the committee that schools approach
SMYL with details of children who are not attending school, are at risk of
falling out or who have been suspended. SMYL then matches the young person with
an employer. As Mr Gowegati put it:
...they are taking them on, because we are paying the wages for
them and managing the process, and, all things being equal, they will employ
them at the end of the program. It puts enormous pressure on the charity to
meet the wages of 500 or 600 kids every year—between Aboriginal kids and non‑Aboriginal
kids—which we have to do. Having said that, it is about the only thing we can
point to that actually gets these kids, who are completely disengaged, into the
world of education and employment with a 70 per cent success rate. So it does
work. As I keep saying, it is not a stick to punish them; it is the fact that
they are guaranteed income. They are being paid to go to work. That is what
gets them in.[35]
4.32
The committee considers the issue of funding youth and Aboriginal and
Torres Strait Islander employment programs in chapter 6 of this report.
Aboriginal and Torres Strait
Islander peoples' health
4.33
Poor health outcomes among the Aboriginal and Torres Strait Islander population
remain an area of acute and ongoing concern. Australia's Health 2014,
released by the Australian Institute of Health and Welfare, found that Aboriginal
and Torres Strait Islander Australians have a burden of disease two to three times
greater than the general Australian population and are more likely to die at
younger ages, experience disability and report their health as fair or poor.[36]
4.34
The Productivity Commission's 2014 Key Indicators report found
that the health of Aboriginal and Torres Strait Islander peoples continues to
lag well behind that of the general population. Some of the report's findings
included:
-
in 2012–13, 39.3 per cent of Aboriginal and Torres Strait
Islander Australians aged 15 years and over reported their health status as
excellent or very good. This was a decrease from 43.7 per cent in 2008;
-
in 2012–13, around one in seven (13.6 per cent) of Aboriginal and
Torres Strait Islander Australians aged 18 years and over had not consulted a
GP/specialist in the previous 12 months—a decrease from 20.6 per cent in
2004-05 and 19.4 per cent in 2001;[37]
-
the hospitalisation rate for chronic conditions for Aboriginal
and Torres Strait Islander Australians was more than four times the rate for
non-Indigenous Australians;
-
the hospitalisation rate for potentially preventable acute
conditions for Aboriginal and Torres Strait Islander Australians was more than
twice the rate for non-Indigenous Australians;[38]
-
between 2001 and 2012–13, the crude daily smoking rate for
Aboriginal and Torres Strait Islander adults declined from 50.7 to 44.4 per
cent. A similar decline in non-Indigenous smoking rates meant that the gap in
(age adjusted) daily smoking rates remained relatively constant at around
26 percentage points between 2001 and 2011–13;[39]
-
in 2012–13, 69.2 per cent of Aboriginal and Torres Strait
Islander adults were categorised as clinically obese (39.8 per cent) or
overweight (29.4 per cent). Only 27.7 per cent were considered to be of normal
weight;[40]
-
in 2012–13, almost one-third of Aboriginal and Torres Strait
Islander adults (30.1 per cent) reported experiencing high/very high levels of
psychological distress, an increase from 27.2 per cent in 2004–05; and
-
the proportion of Aboriginal and Torres Strait Islander adults
experiencing high/very high psychological distress in 2012–13 was 2.7 times the
proportion for non-Indigenous Australians in 2011–12.[41]
4.35
In its submission to this inquiry, the Social Determinants of Health
Alliance said that '[T]here is a clear relationship between the social
disadvantages experienced by Aboriginal and Torres Strait Islander people and
their current health status (Carson et al. 2007)'.[42]
Ms Yvonne Luxford of the Public Health Association of Australia told the
committee that Aboriginal disadvantage in health can, and must, be rectified:
Social, economic, political and cultural deprivation have
directly contributed to much lower life expectancy and a high burden of disease
across diverse areas such as cardiovascular disease, accidents and injuries,
respiratory disease, renal disease and diabetes—such a high burden of
preventable disease that, as a society, we should simply be ashamed. We should
be ashamed because we can change it...[43]
4.36
Oxfam recommended in its submission that the new funding formula for
Aboriginal health services should be developed in collaboration with Aboriginal
Community Controlled Health Services and peak organisations.[44]
The committee agrees with this approach.
Culture and Aboriginal and Torres
Strait Islander peoples' disadvantage
4.37
Any effort to address Aboriginal and Torres Strait Islander peoples
disadvantage in Australia must identify and overcome the underlying reasons for
these poor outcomes. The committee has not focussed on these matters in any
detail during this inquiry. However, the committee does highlight the following
evidence from Associate Professor Dockery:
Throughout the history of discussion about what policies
should do in Australia to address Indigenous disadvantage, there has been a
constant assumption that Aboriginal and Torres Strait Islander peoples culture
is a barrier to achievement. It is basically a story between two
camps—the self‑determination people, who think Aboriginal and Torres
Strait Islander people should have the right to choose what they want of our
culture and our ways, and the assimilationist camp, who say, 'We've just got to
get them out of their culture and into our culture and then they'll have better
outcomes.' This has been the dialogue and both sides assume the culture is a
barrier. Even the people who believe in self-determination say it is a barrier,
that there is a trade-off but it is a choice they have to make.
There is hardly any empirical evidence on this, and I think I
am one of the only people who has looked at Australian empirical evidence.
The empirical evidence suggests exactly the opposite. People who have
stronger identification and engagement with their traditional culture have
better outcomes. These are not just wellbeing outcomes; these are mainstream
outcomes—employment, education, being less likely to abuse substances, less
likely to end up in jail.
Whatever the solutions are, they have to, for a long time to
come, incorporate Aboriginal and Torres Strait Islander peoples aspirations
relating to important things for them—attachment to country, engagement in
culture, kinship networks. Those things are very important. If you are going to
go down the path of, 'No, you've just got to have employment; you've just got
to increase your income,' it just will not work. In my view, you will add to
200 years of policy failure.[45]
People with disability
4.38
People with disability in Australia have—on average—lower incomes than people
without disability:
-
A 2011 report commissioned by the Australian Network on
Disability found that the average weekly income for a working-age person with a
disability is $344, nearly half that of a person without a disability ($671).[46]
-
Less than 10 per cent of people on the DSP earn an income and
close to half of those that do have earnings receive less than $250 per week. The
average duration on income support for people receiving the DSP is around 10
years.[47]
-
The 2012 ABS Survey of Disability Ageing and Carers found that
people with disability aged 15 years and over are more likely to live in a
household in the lowest two equivalised gross household income quintiles than
those without disability (48 per cent compared with 22 per cent).[48]
4.39
People with disability are under-represented in the Australian labour
market and workforce:
-
The labour force participation rate for those aged 15–64 years
with disability in 2009 was 54 per cent (compared with 83 per cent for those
without a disability).[49]
-
In terms of employment, 50 per cent of people aged 15 to 64 with
disability and 28 per cent of people with severe or profound core activity
limitation were employed compared with 79 per cent of people without
disability.[50]
-
A lower proportion of people with disability were in employment
after receiving employment assistance than the proportion without a disability.
Thirty-six per cent of people with disability who used Job Services Australia
streams 1–4 were employed post-assistance, compared with 49 per cent of all job
seekers who used the program.[51]
-
People with disability are more likely to be working part-time
than people without disability.[52]
-
Forty-five per cent of people with disability in Australia live
in or near poverty[53]
compared with the OECD average of only 22 per cent.[54]
4.40
People with disability in Australia also face poorer health outcomes
than the rest of the population. Some of these outcomes include conditions that
are unrelated to the specific health condition associated with the disability.
People with multiple chronic health conditions have reported spending several
thousand dollars a year on out of pocket health costs.[55]
The Disability Support Pension, the
cost of living and employment
4.41
In its submission to this inquiry, People with Disability Australia (PwD)
emphasised that while having a disability means that everyday life is more
expensive, the Disability Support Pension (DSP) is inadequate to cover for
this additional cost. Further, while the reforms to the DSP since 2010 have led
to a decrease in the number of people on the pension:
...they have not led to an increase in workforce participation
for people with disability. The perverse outcome of these measures is that more
people with disability are now struggling to survive on less income, deepening
the inequality in our communities.[56]
4.42
PwD was also strongly critical of the 2014 federal budget's proposals to
reassess DSP recipients against new Impairment Tables and introduce increased
job‑seeking requirements for people with disability (see chapters 5 and
6). It argued the need for government to address the barriers to employment
through a jobs plan, rather than simply tighten the eligibility requirements
for the DSP.[57]
Housing for people with disability
4.43
The availability of appropriate and affordable housing is a crucial
issue for people with disability. PwD noted that housing issues are a common
concern raised with its individual advocates. It said that:
-
only 28 per cent of people who receive the DSP own their own home;[58]
-
36 per cent of households affected by a disability and renting
paid more than 30 per cent of their gross income for housing (compared with 26
per cent of households with no disability); and
-
the majority of existing homes in Australia are not accessible
for people with disability.[59]
4.44
People with disability rely heavily on social housing options. In
2011–12, 34 per cent of all public housing tenants relied on the DSP as
their primary source of income.[60]
At the hearing in Logan, the Director-General of the Queensland Department of
Housing and Public Works told the committee:
Because of demand there is an increasing need to target
high-subsidy social-housing assistance to those most in need while still
ensuring that other low- to moderate-income earners can access assistance to
stay in or move to the private rental market. In other words, 20 or 30 years
ago social housing was provided to families; today it is provided to high—and
very high needs people. In around 55 per cent of social-housing dwellings there
is at least one tenant who has a disability and around 25 per cent of all
tenants in a social house have a profound disability.[61]
4.45
The committee shares PwD's concern that appropriate housing is provided
for people with disability. PwD has noted that the National Rental
Affordability Scheme (NRAS) is to be phased out, adding:
With no alternative to the NRAS, and no dedicated investment
at a federal or state level to improve appropriate housing availability, people
with disability will still have their housing choices constrained. For some
people this may mean that they are trapped in institutional type settings
because there are no alternatives for them to move to.[62]
4.46
The committee highlights the following observations of the Parliamentary
Joint Committee (PJC) on the National Disability Insurance Scheme in its June
2014 report into the progress of the NDIS trial sites:
[T]he availability of suitable housing for people with
disability was a significant theme in evidence from the trial sites. Witnesses expressed
a wide range of housing concerns including young people living in residential
aged care homes and the deinstitutionalisation of state-run large residential
centres. It is important to note that suitable housing for people with
disability is a significant issue that pre-dates the introduction of the NDIS.
The introduction of the Scheme is an opportunity for this issue to be
addressed. These matters, and the broader problem of the limited stock of
housing for people with disability, require policy leadership at the national
level and should be the focus of the Council of Australian Governments
Disability Reform Council.[63]
4.47
This committee shares the PJC's view that the NDIS presents important
opportunities for governments to address the issue of housing for people with
disability. Further, it agrees with PwD that:
The implementation of the NDIS, on time and fully funded,
will play an important part in addressing the barriers to social inclusion that
many people with disability face in Australia.[64]
If dedicated resources are not provided to guarantee
provision and accessibility of mainstream services for all people with
disability (such as housing, education, healthcare, transport), the
opportunities provided through the NDIS will not be realized and the inequality
of the majority of people with disability will persist.[65]
People with mental illness
4.48
Mental illnesses can have a debilitating effect on the sufferer and his
or her carer(s). Apart from the psychological and physical distresses of the
illness, the sufferer may have reduced productivity, experience
discrimination in the workplace, have periods of unemployment or be permanently
excluded from the workforce. It is clear that having a mental illness can lead
a person to being financially disadvantaged. What is not clear is whether a
person's financial situation could trigger a mental illness.[66]
4.49
The most common mental disorders are depression, anxiety and substance
use disorders. Less common, and often more severe disorders include
schizophrenia, schizoaffective disorder and bipolar disorder.[67]
The National Mental Health Report 2013 estimated that:
-
two to three per cent of Australians—around 600 000 people—have
severe disorders (as judged by diagnosis, intensity and duration of symptoms,
and degree of disability);
-
another four to six per cent of Australians—about 1 million
people—have moderate disorders; and
-
a further nine to twelve per cent—about 2 million people—have
mild disorders.[68]
Access to health, housing and
employment
4.50
Mental Health Australia's (MHA) submission states that 'people with lived
experience of mental illness and mental health carers are over-represented
amongst people on the lowest incomes'.[69]
It noted that having a low income can affect a mentally ill person's ability to
access health services, housing and employment. In terms of accessing health
services, MHA argued:
[I]ncome inequality constrains the choices that people can
make regarding their health and wellbeing. Gap payments and other ‘out of
pocket’ expenses can make accessing services such as General Practice,
psychology and psychiatry cost-prohibitive for people on low to moderate
incomes.[70]
4.51
Mr Josh Fear of MHA told the committee that people with mental illness
face significant costs in addition to the basic cost of living and 'these costs
rise the more health services you need to access'.[71]
He expressed particular concern with the impact of the proposed co-payment on the
capacity of people to seek help with a mental health issue. As Mr Fear told the
committee:
GPs are often the first port of call for someone with a
mental health issue, both someone who has never experienced those symptoms
before and is worrying about what they mean and also people who have an
enduring mental illness that they need to cope with over time. In fact 1½
million GP services are provided every year for a mental health issue.
It is Mental Health Australia's position that a co-payment
will actually discourage help-seeking...We have as many government initiatives at
state and Commonwealth level which have tried to encourage help-seeking,
yet we hear from our members and from the broader mental health sector
that a GP co-payment will do precisely the opposite and discourage people from
getting help early.[72]
4.52
In terms of housing, MHA emphasised the vulnerability of mentally ill
people to poorer housing options, but also the benefit that stable housing can
provide to their recovery. It noted:
There is a strong correlation between homelessness and poorer
health and wellbeing especially in relation to mental health outcomes.
According to the ABS survey of mental health and wellbeing, for the 484,400
people who reported ever being homeless, more than half (54%) had a 12-month mental
disorder, which is almost three times the prevalence of people who reported
they had never been homeless (19%). In addition, specialist homelessness
services supported more than 41,000 people who identified as having mental
health concerns in 2012–13. Conversely stable housing has been shown to improve
chances of recovery from mental illness and having a place to call home is
widely acknowledged as a critical foundation upon which to build a place in
community and social life.[73]
4.53
In terms of gaining and retaining employment, MHA noted that 70 per cent
of Australians with a mental illness are employed. Still:
...rates of labour force participation are lower for people
with mental illness than average, suggesting that more needs to be done to
address the specific barriers people with mental illness face in relation to
paid employment.[74]
4.54
In evidence to the committee, Mr Fear elaborated:
We know that only 38 per cent of people with mental illness
work full time, compared to 55 per cent of the rest of the population. When we
look at people with serious mental illness, the rate of unemployment amongst
people with psychosis is 67 per cent, rather than five per cent. We know that
around 260,000 people on the DSP have a psychiatric disability. We also
know that around 200,000 people on Newstart have an identified mental illness.
I would strongly suggest that many more people on Newstart have a mental
illness that they have not disclosed to Centrelink. Part of that is to do with
the way that Centrelink deals with its customers and part is to do with the
stigma associated with having a mental illness.[75]
4.55
MHA emphasised the economic and social benefits of ensuring that people
with mental illness maintain their employment and productively participate in
the workplace. It proposes a number of measures to increase employment
participation by people with mental illness, including wage subsidies for
employers who employ people with mental illness. These proposals were also put
to the McClure Review on Welfare Reform.[76]
Mental illness and the NDIS
4.56
The committee is aware there is currently work being conducted into the
eligibility of people with psychiatric disabilities for a 'Tier 3' package of
supports under the National Disability Insurance Scheme (NDIS). Some people
with more severe psychiatric illnesses will have financial support to cover the
cost of private psychiatric appointments (among other major expenses). MHA
suggested that the NDIS will provide an individualised support package to 'around
one in four or one in five people with psychosocial disability'.[77]
4.57
The committee notes MHA's concern that carers of people with mental
illness are not currently able to access any kind of financial assistance from
the Commonwealth. This is not the case for carers of people with other
disabilities. Mr Fear suggested that this implied the government was 'picking
favourites' among disabilities. He suggested that there needs to be a review of
the way that assessments for financial support for carers are carried out.[78]
Refugees
4.58
Refugees are another group that face particular challenges in the
Australian labour market by dint of their (often short to medium-term) personal
circumstances. In 2012–13, the Australian Government granted a total of 20
019 visas under the Humanitarian Programme.[79]
The highest number of visas granted in 2012–13 (under the offshore
component) was in the Middle East region (55.7 per cent), followed by the Asia
region (34.1 per cent) and the Africa region (9.9 per cent).[80]
The income of humanitarian entrants
4.59
The renowned Australian demographer, Professor Graeme Hugo, has found
that humanitarian entrants to Australia have the lowest income of migrant
groups.[81]
Commenting on his findings, a 2011 Department of Immigration and Citizenship
report stated that over half of humanitarian entrants have weekly incomes under
$250, compared with just under 30 per cent for the other migration
categories:
[H]umanitarian entrants have the lowest proportion of nil or
negative incomes, which Professor Hugo identified as partly the result of
humanitarian entrants having immediate access to unemployment benefits. The
lower levels of income have other consequences, such as a lesser ability to buy
a house. The research showed that the more recent waves of humanitarian entrants
were slower to enter the housing market and were more likely to be renting. The
older waves and the second generation were, however, more likely to be on a par
with those born in Australia with respect to owning a home.[82]
Barriers for humanitarian entrants
in gaining employment
4.60
The Refugee Council of Australia (RCOA) identified the following
potential barriers to employment by refugee and humanitarian entrants:
-
limited English proficiency;
-
lack of Australian work experience and limited knowledge of Australian
workplace culture and systems;
-
limited access to transport and affordable housing close to
employment;
-
pressures of juggling employment and domestic responsibilities (a
particularly significant issue for women);
-
lack of appropriate services to support employment transitions;
-
the impacts of past trauma on health and wellbeing;
-
downward mobility and the pressure to accept insecure employment,
which can result in underutilisation of skills and hamper longer-term career
advancement;
-
lack of qualifications or difficulties with recognition of
qualifications, skills and experience;
-
discrimination and negative attitudes; and
-
visa restrictions (in the case of asylum seekers and temporary
humanitarian visa holders).[83]
4.61
Professor Hugo interviewed humanitarian entrants to gauge—among other
things—the barriers that they have faced in gaining employment in Australia.
Prior to migration these factors included exposure to violence, instability and
persecution, lack of education, lack of knowledge about the Australian
labour market, lack of documentation prior to migration and misinformation
about employment opportunities. Post-migration, the identified barriers
included: mental health issues; illiteracy and low English proficiency; lack of
opportunities or finances to have skills recognised; lack of knowledge about the
skills recognition processes; lack of established networks in Australia; and experiences
of racism and discrimination.[84]
4.62
Professor Hugo also found that 69.7 per cent of those surveyed had at
some time sent money to their homeland. It was not unusual for recent African
migrants to send 10 to 20 per cent of their weekly income to their families in
the homeland or in a refugee camp.[85]
4.63
The RCOA's submission to this inquiry focussed on the capacity of
refugee and humanitarian entrants to access income support payments. It noted
that these people tend to be younger than the general Australian population: between
2009–10 and 2013–14, 87 per cent of the 70 000 people who were granted
humanitarian visas were under the age of 35 when they arrived in Australia. The
RCOA argued that given their age profile, and the fact they often rely on
income support payments during their early years of settlement, refugees are
'likely to be disproportionately affected' by the 2014 budget measures.
4.64
The RCOA emphasised that refugee and humanitarian entrants are often
'desperate to find stable employment'. Accordingly, it argued:
...the application of punitive financial “incentives” to
refugee and humanitarian entrants would represent a serious misdiagnosis of the
reasons for their (initially) lower participation in the workforce and cause
significant financial hardship without enhancing employment outcomes.[86]
4.65
The committee considers that a longitudinal analysis on how humanitarian
visa holders have fared in the Australian labour market over the first 10 years
of their settlement would be very useful. It would be particularly worthwhile
for this study to combine quantitative data on humanitarian entrants' income
levels over time with qualitative surveys—of the type conducted by Professor
Hugo—which identify the barriers and the keys to obtaining and retaining
employment.
Older workers and those at risk of
poverty in retirement
4.66
The terms of reference for this inquiry direct the committee to consider
the impact of income inequality on older workers and workers at risk of poverty
in retirement. Within this demographic, there are varying degrees or actual and
potential hardship and disadvantage. There are:
-
older unemployed people;
-
pensioners living in poverty;
-
those older workers on a low income with no assets or retirement
savings;
-
parent carers; and
-
those on relatively good incomes who have suffered investment
losses and the prospect of insufficient savings to self-fund their retirement.
Older unemployed people
4.67
Older unemployed people can face particular difficulties regaining
employment. A substantial number of older Australians of working age are not
employed. Department of Social Services data show that in September 2014,
there were nearly 400 000 job seekers receiving the Newstart
Allowance. Of these, 79 163 were aged over 50, nearly 20 per cent of all
Newstart recipients.[87]
4.68
The Department of Social Services has noted that between 2010 and 2013,
there was a 41.2 per cent increase in people in their 50s and 60s receiving the
Newstart unemployment benefit, much higher than the overall growth across all
demographics.[88]
Older people are more likely to be unemployed long-term than any other group.[89]
4.69
At the Logan hearing, Ms Bartolo told the committee that some of YFS
Limited's clients are older men in their late 50s who have lost their jobs and
cannot meet their commitments.[90]
Ms Mary D'Elia of Baptcare emphasised that unemployed older Australians living
on the Newstart Allowance have an income level 'generally acknowledged as
inadequate'. She argued that the pension age should not be raised to 70 years
without a simultaneous increase in the level of the Newstart Allowance.[91]
4.70
The committee recognises and supports government initiatives to assist
older unemployed Australians to gain work and encourage older workers to remain
in the workforce. The number of Australians aged over 55 (both male and female)
participating in the workforce has increased since the early 1990s. The ABS has
found:
In 2009–10, there were around 5.5 million Australians aged 55
years and over, making up one quarter of the population. Around one third of
them (or 1.9 million) were participating in the labour force. People aged 55
years and over made up 16% of the total labour force, up from around 10% three
decades earlier. The participation rate of Australians aged 55 and over has
increased from 25% to 34% over the past 30 years, with most of the increase
occurring in the past decade.[92]
Pensioners living in poverty
4.71
In its submission to this inquiry, the COTA Australia (COTA) stated that
older people are consistently over-represented in poverty statistics. It noted
that incidences of poverty are high for single older women and single older men,
as well as older couples.[93]
4.72
COTA did recognise that changes to pension arrangements in 2009
alleviated the levels of poverty. As part of these changes, the aged pension
increased and indexation arrangements were introduced that fixed the age
pension to a proportion of Male Total Weekly Average Earnings (MTAWE) and set
the biannual indexation at the best of the Pensioner And Beneficiary Living
Cost Index, the Consumer Price Index (CPI) or MTAWE.[94]
4.73
Welfare agencies told the committee that increasingly, older homeless
people are presenting to them in need of assistance. Ms Cheryl Fairclough of
Baptcare in Tasmania told the committee:
More and more agencies are seeing older people homeless for
the first time in their lives at retirement, particularly older single women.
Studies by the University of Melbourne looked at the fact that, even in the
buoyant years of 2001 to 2007, one in 12 older people suffered severe
disadvantage and poverty. Certainly, for single pensioners, one-third,
generally, are suffering financial and housing stress.[95]
4.74
Ms Fairclough's colleague, Ms D'Elia, told the committee of the
particular relevance of seniors living in poverty in Tasmania. She noted:
By June 2013 more than 17 per cent of Tasmanians were aged 65
and over—the highest percentage of any Australian state or territory. As an
aged-care agency, Baptcare is particularly concerned with the growing poverty
and housing insecurity amongst seniors. Indeed, around 40 per cent of the
aged-care residents at our Baptcare Karingal community facility in Devonport
are financially and socially disadvantaged. We also have a target of 30 per
cent of our home care packages being provided to disadvantaged aged clients.
4.75
Baptcare and COTA both expressed strong concern at the plans to shift
the indexation for aged pensions from a percentage of the average male weekly
earnings to the lower baseline of average weekly earnings and then indexing
pensions to CPI instead of wages growth. In terms of the impact of this
measure, Baptcare identified a particularly vulnerable group as grandparents on
the aged pension or on Newstart with responsibility for caring for their
grandchildren.[96]
Older workers on a low income with
no assets
4.76
Of great concern for the committee is the cohort of older Australians
who have lived for many years on a low income and who face a retirement without
assets. The committee is aware that the Household Income and Labour Dynamics in
Australia (HILDA) Survey contains data on Australians' asset holdings by age
group. The eighth statistical report contained the following table (Table
4.1). The report noted:
...in all age groups, there has been a decline in home
ownership between 2001 and 2010, but the largest declines have been for people
aged 35 to 54 years. One way of viewing these changes by age group is to take a
‘birth cohort’ perspective. Thus, the homeownership rate when aged 35 to 44
years was 4.5 percentage points lower for the cohort born between 1966 and 1975
than for the cohort born between 1956 and 1965; and the home‑ownership rate
when aged 45 to 54 years was 5.5 percentage points lower for the cohort born
between 1956 and 1965 than for the cohort born between 1946 and 1955.[97]
Table 4.1: Rates of home ownership by age group (%)
|
|
Mean rate over 2001 to 2010
|
Change in rate 2001 to 2010
|
|
18–24
|
10.4
|
–0.3
|
|
25–33
|
43.1
|
–1.8
|
|
35–44
|
67.8
|
–4.5
|
|
45–54
|
77.9
|
–5.5
|
|
55–64
|
83.3
|
–1.1
|
|
65 and
over
|
82.7
|
–1.1
|
Source: Melbourne Institute of
Applied Economic and Social Research, Families, Incomes and Jobs, Volume 8,
2013, p. 93.
4.77
In additional information provided to the committee, the Queensland
Council of Social Service (QCOSS) noted:
One of the significant challenges older people who live a
life-time of low income is their inability to purchase a home. Without a home
of their own many of these older people rely on the private rental market to
meet their housing needs and face a significant struggle meeting the high cost
of renting which can absorb a large proportion of income.[98]
4.78
This issue will be returned to in chapter 6 of this report in the context
of how negative gearing limits the stock of owner-occupier housing, forcing
low-income renters to accept market rental rates.
4.79
The Western Australian Council of Social Service (WACOSS) told the
committee at the Rockingham hearing that early intervention is needed to ensure
that older workers facing retrenchment are provided with retraining
opportunities while they are still employed. As Mr Chris Twomey, WACOSS's Director
of Social Policy, told the committee:
...there is some interesting work that the commissioner for age
discrimination is currently doing that is looking at the opportunities to do a
scan of older employed people in their mid-50s who are in the industries,
as in South Australia, that are at risk of winding up and that the best
opportunity to intervene and retrain is while these people are still at work.
As soon as they are unemployed, they have all of those additional barriers to
finding more work. That is a promising area to respond to.[99]
4.80
In September 2014, the Hon. Susan Ryan AO, the Age Discrimination
Commissioner, told the National Press Club in Canberra:
...we don’t want to see a repeat of the South Australian car
manufacturing industry collapse, where middle-aged skilled workers were laid
off and left—initially at least—with no advice and no direction as to how they
might find new jobs.
What workers in this situation need – and virtually every
individual does at some point in their working life – is a structured process
by which they can review where they are and plan for their ongoing participation
in employment.
That is why I am calling today for a National Jobs Checkpoint
Plan. I am urging a high profile, widely supported, and nationally coordinated
approach to helping all people at midlife to check where they are and change
direction if they need to. This national approach can be developed by
governments, industry and vocational education providers working together. I
see TAFE right at the center of this Plan. TAFE colleges have the required
training skills and links with local employers and government programs, but
these links need to be strengthened and supported for vocational education
everywhere throughout Australia.
...Initially under this Plan, anyone approaching 50 could
attend a local TAFE to get a skills analysis, and basic advice about which
sectors are growing and need workers, where the jobs are located in that
region, and what skills and credentials are required to secure one. A
well-targeted checkup and redirection at 50 could set a person up for another
20 years work, age pension age rules notwithstanding.
This is not a crisis management plan, it is a preventative
approach that would have older people recharging and moving smoothly into their
next stage of employment.[100]
4.81
The committee believes that the focus on well-coordinated, preventative
approach based on vocational education and training is sound. It will require
an appropriate level of investment from the Commonwealth and State Governments
and a framework whereby older workers in declining sectors can be effectively
case managed. Chapter 6 returns to this issue.
Parent carers
4.82
Another cohort of older person at risk of financial hardship is parent
carers. The long-term sacrifices that these parents make in caring for their
child often leaves them without an income, a career or any assets. The
committee heard from Ms Sarah Walbank of Carers' Queensland that:
The lack of appropriately skilled and affordable locally
based care services leaves them [parent carers] with no alternative except to
leave the full-time workforce and become full-time carers—a loss to the economy
that is rarely acknowledged in the public domain. This scenario is very aptly
illustrated by a quote from a carer to our annual quality of life report. She
says: 'My daughter is 24 years old but has funding for only 42 hours per
week. This means that we are together for no less than 110 hours per week. As a
consequence, I have no time to socialise, no assets and no way back into the
workforce.' The consequence of a parent carer's decision to leave the workforce
and accept more marginalised work is not merely a budgetary inconvenience; it
is a significant decision that has the potential to negatively impact the
family's financial capacity not only in their working years but also longer
term in their retirement years. As one carer said: 'The future security is
a subject that keeps me up at night and it constricts my chest. I have very
little superannuation left and I have no career. I have been a carer now for 14
years, and there is no end in sight. What will be my fate when I am aged and
impoverished.[101]
The challenge of self-funding
retirement
4.83
About eighty per cent of Australians of retirement age draw a full or
part pension.[102]
Despite the significant political emphasis and national investment in
superannuation, only a minority of Australians are self-funded retirees.
4.84
The aftermath of the Global Financial Crisis (GFC) brought with it
public commentary in Australia (and internationally) about the impact of the
GFC on older workers' superannuation nest eggs. Would they still be able to
self-fund their retirement and if so, for how much longer would they have to
work? Journalist George Megalogenis wrote in October 2011:
In the three years before the GFC, when Australia was running
out of workers, men in their late 50s were the only grouping to reduce their
labour force participation. The lure of former Liberal treasurer Peter Costello's
tax‑free super payouts, promised in the 2006 budget, seemed to be driving
people into early retirement.
But the income shock of the GFC has reversed the trend. In
the three years since the GFC, men in their late 50s have been responsible for
the second‑sharpest jump in labour force participation across the
economy. Only women aged 60-64 years entered the workforce at a faster rate. The new
research by The Weekend Australian confirms the role the GFC has played
in the greying of the workforce.
But the bigger picture is just as interesting. The baby
boomers have known for some years that the compulsory super system wouldn't
deliver its promise of a self-funded retirement in their lifetime. The super
system only reached the 9 per cent contribution benchmark in 2002—when
employers had to kick in 9 per cent of a worker's wage into a super fund.[103]
4.85
The revenue collected from the previous federal government's mining
super profits tax was earmarked to increase the Superannuation Guarantee Charge
(SGC) from 9 per cent to 12 per cent. The repeal of the mining tax in this
Parliament has meant that this increase will now not occur until at least 1
July 2021.[104]
4.86
The Assistant Secretary of the Australian Council of Trade Unions (ACTU),
Mr Tim Lyons, told the committee that the freeze of the superannuation guarantee
charge will have a regressive impact. As he explained:
The delay in increases to the superannuation guarantee charge
will certainly result in lower retirement incomes from super being available to
middle‑income earners in particular but also low-income earners. Every
year that is delayed will result in a smaller pool of retirement income savings
for those people. The delay in the SG probably will not affect high-income
earners in the same way as much of the money that is pumped into the system is from
additional voluntary contributions that people make in order to access and take
advantage of the tax concessions.[105]
4.87
The committee has strong concerns about the SGC freeze. It not only
fears the regressive impact of this policy but highlights the contradiction of
the government seeking to boost retirement incomes and reduce reliance on the
aged pension while capping personal and employer contributions to
superannuation.
Gender and inequality
4.88
There has been important recent research into the gender pay gap in
Australia. In November 2014, Curtin University academics Associate Professor
Siobhan Austen, Associate Professor Rachel Ong, Dr Sherry Bawa and Associate
Professor Therese Jefferson published research findings which showed that Australia's
gender wealth gap has widened sharply over the past decade. Across all age
groups, the disparity in average wealth between single men and single women grew
from $18 300 to $47 000 been 2002 and 2010. The study found that single
young women had a little over half the average assets of their male
counterparts. The main reason for this differential was the growth in the value
of housing assets owned by single men.[106]
4.89
In terms of earnings, Associate Professor Austen and her colleagues
found that the differential between the average full-time male worker and the
average full-time female worker was 18.2 per cent in August 2014. This was the
largest differential since 1994. Associate Professor Austen noted that these
trends seemed at odds with the trends of greater female participation in the
workforce and the higher number of women in tertiary education than men.[107]
4.90
In evidence to the committee, Associate Professor Austen also commented
on research she has conducted into gender income inequality with Professor Gerard
Redmond of Flinders University. The central finding of this research was that
as more women have entered the Australian workforce since the 1980s, family
income inequality was 'generally been pushed downwards'.[108]
She explained this research to the committee in the following terms:
...we looked at the increasing trend in male earnings
inequality as well as female earnings unequally, which increased by a lesser
amount in the decades 1980s and 1990s through to 2007, but from a higher base.
The trend towards inequality in both earnings distributions was upwards.
In terms of family income inequality, we found the growth in
women's earnings within Australian households had a mixed effect on family
income inequality. In a period 1982 to 1995-96, women's earnings' growth had
what we call a disequalising effect on family income inequality. This happened
because, increasingly, the growth in earnings by women was happening in
households that were characterised by high male earnings.
From 1995 through to 2008 an opposite pattern emerged, where
we saw the growth in women's earnings occurring more substantially in
households where male earnings were relatively less. In that period, as women's
earnings increased, we saw it having a positive or equalising effect on
family-income inequality. These changes in trends were associated with big
changes in women's employment over those decades.[109]
4.91
Associate Professor Austen also drew the committee's attention to her research
on women's share of total income. She noted that this share 'still sits
somewhere below 40 per cent, at around 38 per cent' and portrayed the broader
picture in the following terms:
Women remain overrepresented in low-income groups...and
underrepresented in high-income groups within our community. We have not seen
much progress in women's share of income despite...the rapid rise in employment
and the rapid rise in education. There are several reasons for this. Women's
employment rates are relatively low. When they do work they tend to work
part-time hours, much more than men, and their wages when they are in paid work
tend to be relatively low as well.[110]
4.92
Mr Tim Cowgill from the ACTU told the committee:
...the gender pay gap is not only large but it has risen quite
substantially since the mid 2000s and it is now at its highest since the 1980s.
That is a concern in and of itself, regardless of the subsequent effects on
wealth inequality and other things. But, of course, if women on average are
earning less, they are likely to have less retirement savings and that compounds
over time.[111]
4.93
Welfare agencies corroborated the financial hardship faced by women.
Mr Llewellyn Reynders of the Victorian Council of Social Service (VCOSS)
spoke of 'the feminisation of poverty in Australia' and stated that 'the gender
pay gap is now at its worst level in 20 years'. He told the committee that
VCOSS has noted a growing number of incidents of women experiencing
homelessness, including older women, as well as a rise in Victoria in the
number of family violence notifications.[112]
Single parents
4.94
Single parents—the majority of whom are single mothers—are another group
that is highly susceptible to poverty and exclusion from the workforce. Twenty
years ago, the Australian academic Dr Michael Jones wrote:
Single parents—the major cause of the 'feminisation of
poverty'—are regarded as a recent and serious social problem in most western
countries... Poverty surveys repeatedly show single parents to be the most
vulnerable poverty group. Unlike most of the aged, single parents have not
accumulated the assets, especially a dwelling. Many have low skills and low
earning potential; inadequate low-cost childcare is a major impediment to
employment and self-sufficiency...Many single parents are young, so they can
face many years of dependency. This is damaging to their future, as well as
being costly to the state.[113]
4.95
Recent data show that in terms of both workforce participation and
income, single parents fare less well than couples with dependent children. In
its 2013 report, the Australian Institute of Health and Welfare provided the
following data (as of June 2011):
-
lone mothers headed 86 per cent of single parent families with
children aged under 15 years;
-
single parent families with a child under 15 were much more
likely to be jobless (39 per cent) than couple families (5 per cent);
-
fifty-four per cent of single mothers with a child under 15 were
in employment in June 2011, compared with sixty-seven per cent of single
fathers with a child under 15; and
-
a higher proportion of single mothers were in part-time work (30
per cent) than in full-time work (24 per cent). Conversely, a higher proportion
of working single fathers had full-time work (53 per cent) than part-time work
(14 per cent);[114]
-
in 2009–2010, the median weekly income of a single parent with
dependent children was $478 compared with a median income of $738 for a couple
with dependent children;
-
38.9 per cent of single parents with dependent children were in
the lowest income quintile compared with 16.9 per cent of couples with
dependent children;
-
only 3.6 per cent of single parents with dependent children were
in the top quintile of income earners; and
-
the highest childcare attendance rates were for children in
one-parent families with an employed parent (82 per cent).[115]
4.96
Several witnesses drew the committee's attention to the vulnerability of
single parents to poverty. Ms Terese Edwards of the National Council of Single
Mothers and their Children (NCSMC) noted:
...in March 2013, the latest longitudinal study, HILDA, found
that child poverty in sole-parent families jumped 15 per cent in the last
decade. This occurred throughout our prosperous years. One in four
children residing in a sole-parent family will be impacted by poverty.[116]
4.97
The Victorian Council of Social Service told the committee that single
parents are 'three times as likely to live in poverty as couple families with
children—25 per cent versus nine per cent'.[117]
QCOSS noted the 'very high proportion' of households that are one parent
households in Queensland, relative to the other States. It provided the
committee with the following figure by way of illustration. Figure 4.2 shows
that Tasmania and Queensland are the States with the highest percentage of one
parent households with dependent children.
Figure 4.2: Proportion (per cent) of
households that are one parent households with dependent children, Australia
States 2011–12
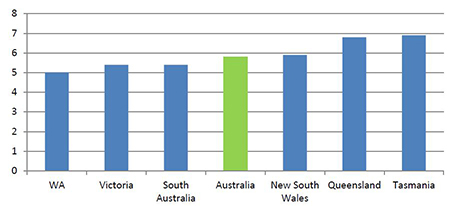
Source: Queensland Council of Social Service, Additional information
provided at public hearing on 8 October 2014. Source of data is the
Australian Bureau of Statistics, Cat. 6523.0 – Household Income and Income
Distribution
4.98
QCOSS also noted the high proportion people receiving a single parent
benefit who reside in Queensland. In March 2014, there were almost 63 000
parenting payment single recipients in Queensland—just over 24 per cent of
recipients nationally. A single parent with two dependents receiving the
Parenting Payment Single and working part-time on the minimum wage would earn
$22 per week less than 'a very basic standard of living in September 2013'.[118]
4.99
Chapter 5 of this report notes that the likely impact of the proposed
budget measures on a single-parent, single-income family will be substantial.
On one estimate, the reduction in income for this cohort would be, on average,
10.8 per cent.[119]
Changing perceptions and investing
in single mothers
4.100
NCSMC representative, Ms Edwards, told the committee:
One of the things that we believe has happened with sole
parents is that there is greater awareness from the community, and also from
the media, commentators and members of parliament, that there is a group who
are really doing it hard and have been doing it too hard for way too long,
and they are not to blame. The myth of a single mother with three
children, who had no aspirations for herself or her family, who did not want to
study or was not in the workforce, has been well and truly smashed.[120]
4.101
NCSMC emphasised the need to recognise the value and economic
contribution of unpaid care and understand that this in itself can be a barrier
to employment.[121]
Ms Edwards told the committee:
When I think of these sole parents, the struggling mums
raising, loving and nurturing their children into adulthood, I imagine an
obstacle course. I imagine the first, harsh obstacle is our inability in
Australia to measure or respect the contribution of unpaid care. When that is
our take on it, it means that these mums are particularly vulnerable and the
assistance they receive is not viewed as an investment; it is viewed more as
somewhere we may be able to find more savings. She may be able to get over that
hurdle but then, bang, her little one turns eight and she moves across to
Newstart. Those families—and I noticed there was some discussion before
about housing stress et cetera—lose up to $140 per week. They are in severe
housing stress. They will not be able to recoup that. We then have the child
support conundrum....
The last part is that, once she has survived all of that, we
then try and blame her. We then question her motives and suggest that perhaps
she is not doing enough for her children. How can we make it even harder and
force this mother to do more?[122]
4.102
The committee considers that more should be done to assist single
parents through a case based system which includes income support payments and
training and employment opportunities. Given the important role that
single parents perform in raising children, these payments and opportunities
should be seen for what they are—an investment in the future. Adequate payments
need to be a platform to allow single parents to take advantage of training and
employment opportunities. Chapter 6 develops these arguments in more detail.
'Other factors'
4.103
This chapter has noted the disadvantage experienced by several groups in
Australian society. While for each of these groups a low income is a symptom of
a deeper disadvantage, a low income generally compounds this disadvantage. It
limits a person's ability to spend on even the most basic of necessities—such
as food, housing and utility expenses—which will often worsen a person's
physical and mental wellbeing. People in these groups are highly susceptible to
long-term poverty.
4.104
In addition to these multiple reinforcing disadvantages, and overlap in
the membership of these disadvantaged groups, there are other factors that
compound the impact of income inequality on these groups. The committee
highlights two in particular:
-
the regional nature of disadvantage; and
-
the vulnerability of disadvantaged groups in the labour market.
Geography and disadvantage
4.105
An often-noted aspect of income inequality in Australia, as in other
countries, is the regional nature of economic and social disadvantage.[123]
As the Bankwest Curtin Economics Centre put it:
...individuals who possess particular attributes can have
higher propensities of poverty. However, possessing these attributes together
with living in a particular area can exacerbate and prolong poverty and
disadvantage.[124]
4.106
The committee had the opportunity to visit three areas with particular economic
and social disadvantages: Logan in south-west Brisbane, Elizabeth in the north
of Adelaide and Rockingham, 40 kilometres south of Perth. There are a number of
distinctive demographic trends common to these areas:
-
above average unemployment and youth unemployment (see Figure 4.3);
-
a range of associated social problems including family breakdown,
homelessness, crime and substance abuse;[125]
-
single parent families account for a high proportion of all
families in these areas (11 per cent in Logan and Rockingham and 17 per cent in
Elizabeth);[126]
-
a low proportion of educated professionals and a high proportion
of vulnerable occupations in the 'old-economy' (manual labour, manufacturing);[127]
-
a relatively lowly rank on the socio-economic index for areas
(SEIFA) with incomes below the State average;[128]
-
a high proportion of residents did not complete Year 12 (31 per
cent in Elizabeth, 39 per cent in Rockingham, 43 per cent in Logan);[129]
and
-
public housing accounts for a large share of tenure.[130]
Elizabeth
The
committee heard that the suburb of Elizabeth, created 60 years ago, faces
particular hardships. In December 2013, the Chief Executive of Holden
Australia, Mr Mike Devereux, announced that 'Holden will cease
manufacturing in Australia by the end of 2017 and that this factory will no
longer operate beyond that'.
Reverend
Peter Sandeman the Chief Executive Officer of AnglicareSA and a Board
Member of the Automotive Transformation Taskforce, has said that the
'closure of Ford in 2016 followed by Toyota and Holden in 2017 will lead to
the total collapse of the automotive sector in Australia.' This will result
in the direct loss of 1760 jobs in the Holden Elizabeth factory and the
indirect loss of over 13 000 jobs.
South
Australia is embarking on a period of significant transformation. The
short-and long-term economic and social costs as a result of the loss of
the automotive industry will have major impacts in South Australia in terms
of businesses and workers in the automotive supply chain and in specific
regions. The closure of an entire industry of this scale, complexity and
importance is without precedent.
Reverend
Sandeman discussed the challenges facing the Elizabeth community.
There
has been a process of stripping away the industrial base of the northern
suburbs over the last 20 years....The difficulty now is that the local jobs
are disappearing. Unless we are able to entice in the new Playford era
significant investment into the northern suburbs and Edinburgh Parks and
reuse the Holden site, even greater social and economic dislocation will
result...This dislocation is much larger and, dare I suggest, much more
difficult to resolve.
In evidence to the committee, Mr Joe
Gannon, Manager of Homelessness Services with UnitingCare Wesley Port
Adelaide spoke about the likely social implications of these challenges.
We
are working with two or three decade's worth of issues here. What we are
really talking about in particular with places like Holden closing down is
that we will feel the effect in homelessness services. There are no two
ways about it.
Figure 4.3: Unemployment rate for city
of Playford, 2004-2013
Figure 4.4: Unemployment rate for city of Rockingham, 2004-2013
Figure 4.5: Unemployment rate for city
of Logan, 2004-2014
Disadvantaged groups in the Australian
labour market
4.107
The nature of the Australian labour market is such that people in the
disadvantaged groups identified in this chapter tend to be particularly
vulnerable to economic exclusion. They may have had discouraging experiences in
the labour market including having parents that have never, or seldom, worked.
The work that they do is often part-time and/or on a contractual basis.
The challenge of job readiness
4.108
One of the themes of this inquiry has been that people in disadvantaged
groups sometimes lack the basic employability skills to participate in the
labour market. These skills include being presentable, punctual and able to
relate well to colleagues. For many, these attributes may seem easy to acquire
but for a person with very little money, substance abuse issues, an unstable
and even threatening home environment, and a long history of exclusion from the
workforce, they are significant barriers.
4.109
Dr Ian Goodwin-Smith of Flinders University in Adelaide drew the
committee's attention to the work of Dr Anthony Mann, the Director of Policy
and Research at the Education and Employers Taskforce in the United Kingdom.
Dr Mann's work emphasises the importance of students having a positive
interaction with employers. His research shows that there is a positive connection
between employer engagement with students at school and the employability and
earning power of a young adult who could recall that same interaction.[131]
4.110
In referencing Dr Mann's work, Dr Goodwin-Smith told the committee that,
by interacting with employers, young people:
...get a more complex array of social and cultural capital—they
get that life experience which you do not get, necessarily, in an
intergenerationally unemployed family...
There needs to be a lot of work done, with people who have
been unemployed throughout the generations, to overcome that kind of cultural
and social exclusion. There also needs to be a commitment to carrying that work
through to post-employment support. That is what a lot of our research showed
us as well. Worker acculturation and post-employment support using a
case-management approach are really important.[132]
4.111
The committee draws attention to the difficulty for people suffering
significant instability and turmoil in their private lives to function and
perform at work. As Dr Goodwin-Smith explained:
The other kinds of things that are really important, taking
this life-first approach, are overcoming impediments that exist across the
range of life domains. Homelessness and drug-and-alcohol and mental-health
problems are disproportionately represented amongst the cohort of people I am
talking about. It is hard to get to work and put your mind to that if you are
wondering where you are going to sleep tonight, and it is hard to have all of
the necessary accoutrements of work that you need under your belt—such as an
ironed shirt et cetera—by nine o'clock in the morning. We are talking about a
range of problems the solution to which is out of scope for a lot of people who
are severely workforce excluded. To focus on those types of barriers across
life domains is also important.[133]
4.112
Ms Lin Hatfield-Dodds, the National Director of UnitingCare Australia,
told the committee of the hopelessness that some of her clients feel in
trying to engage with the labour market. As she explained:
There are people growing up in areas of locational
disadvantage, the poverty postcodes, where no-one in a community has ever had a
job. There are hard issues and what are often called soft issues. Those
are actually the most intractable. The hard issues are things like skilling
people up for labour market attachment and thinking around the health,
transport, dental and housing issues that we all know about. Then those really
intractable issues at the core are about people's expectations and hopes for themselves
and their communities. My chair, who has lived and worked his whole life in
Port Adelaide, talks about loss of hope and fear of failure being the two least
tractable and most difficult things that we work with people around. When you
are working with people who are very deprived and very excluded, they do not
even dare to hope things can go right because right from the minute they were
born into a disadvantaged family in a disadvantaged area they have been
excelling at failing on almost any social or economic dimension.[134]
Casual and contract-based work
4.113
When a disadvantaged person is able to obtain employment, this will
often be of a casual, part-time or contractual nature. This work is not
conducive to supporting households, buying a property, renting in the private
market or preparing for retirement. Professor Alan Duncan, the Director of the
Bankwest Curtin Economics Centre, told the committee:
It also has to be the right type of employment. One of the
caveats, or just a note of warning, relates to what I see to be an increasing
prevalence of casual contracts. Those casual contracts, even though in
employment, do not necessarily deliver that long-term support for
households in such positions. There is an insecurity of employment associated
with casual contracts. There is a problem with the lack of accumulation of
resources for a time and through superannuation accumulation. So, whilst
employment in and of itself is a good target, one should also deal with genuine
and substantial attachments to the labour market.[135]
4.114
Other witnesses also identified the importance of quality employment
opportunities and positive experiences in the workforce. Contrary to some of
the political rhetoric of the past 20 years, Dr Goodwin-Smith told the
committee:
There is no evidence to suggest that 'a job is a job' is a
good thing. A job can be a very bad thing. People who are marginalised and used
to the experience of marginalisation—who are, in other words, quite
vulnerable—are really open to those sorts of negative experiences. I do not see
any basis, other than wishful thinking, to assume that a job is inherently a
good thing. Unemployed people need good jobs and quality jobs or their ability
to keep jobs is compromised. Our research demonstrates that.[136]
4.115
Associate Professor Austen agreed:
I think what has been co-opted is an argument, and a good
argument, about the enormous damages of unemployment and the importance of
work to people's wellbeing, but a lot of the inequality in our community exists
between people who are in paid work. We know that the damages of low‑paid
work and low-quality jobs are particularly large. That type of argument, just
getting people into work—paying strong attention to the supports that many
people need to achieve good employment and good employment outcomes for
themselves and their families is what is most important.[137]
4.116
Indeed, the committee heard that casual employment arrangements are
often those that are first to go during an economic downturn. Further, where
disadvantaged people lose work, they often do not return to the labour market
for a significant period. As Ms Edwards told the committee:
With insecure work we know that when the economy hits a bump
or a huge bump—and it happened in the global financial crisis—it is the casual
people who fall off the tree and do not come back, and that includes a lot of
sole parents.[138]
4.117
In this context of insecure employment, WACOSS highlighted the
importance of people's financial and personal resilience. Mr Twomey told the
committee that with insecure work on a low income, people may face ongoing
poverty. Further, they may have limited access to the income support system
because of the assets test. As he explained:
...one of the biggest single problems that we have is simply
the adequacy of people's incomes, and then, beyond that, when they are coming
in and out of the income support system, whether that is helping and supporting
them to build up a bit of financial resilience. At the moment it is undermined
because of our asset tests and so on.
...The issue there is that, if you go into short-term insecure
employment, you earn a certain amount of money. You then have to spend all of
that money before you are then eligible to go back onto income support.
Where is the benefit that has come from that work that you have done? What
are you doing that is about the financial resilience that puts you in a
position when you get the next job to have the money that you need to get along
to interviews, get work clothes or simply bridge that transition where, 'My
income support has stopped, but I haven't got my first pay cheque'.[139]
4.118
In addition, the housing opportunities for those in insecure employment
are limited. A person with low pay and short-term work contracts will
experience difficulty accessing the private rental market—both securing a
rental agreement and paying rent—or obtaining a mortgage. Mr Mark Glasson
of Anglicare WA, told the committee of the situation in the Western Australian
housing market:
The state affordable housing strategy and the target of
20,000 new premises is really good, and that is getting people into more
affordable housing through shared equity and things like that. But there is
still a sizeable body of the population for whom home ownership is not a
realistic option. They are the people...who are in insecure employment and
short-term contracts and things like that. Home ownership is not an option for
most of those people. And if you look at the history of the construction of
public housing over the last 50 years what you will see is that we have stopped
doing it. So we have a reliance on a private rental market that cannot meet the
demand, but it is not affordable for the people who need it anyway.[140]
Worker (im)mobility
4.119
The committee inquired as to why those facing redundancy or those at the
end of their employment contract could not move to seek employment
opportunities elsewhere. Reverend Sandeman identified the following factors
that constrain worker mobility:
First is information and understanding about the labour
market and what is available elsewhere. We do not have authoritative
information which can guide individuals in their decision making. Second, it
depends on your family life cycle. If you have a family that is closely
connected into a community, where the kids are playing sport for the local team
et cetera, it is terribly difficult to move them. If you are trapped in a
mortgage on a property that is of declining value, that is a major issue as
well.[141]
4.120
There are also personal reasons as to why a person may be unable to
relocate for work. Mr Craig Comrie, the Chief Executive Officer of the Youth
Affairs Council of Western Australia, explained that a lot of young people with
high or complex needs need to be around their support networks. He told the
committee that these young people need to:
...have the support of their family, friends, peers, youth
workers, social workers, whoever in order for them not just to find employment
but to ensure that their mental health is sound, that their health is fine and,
if they have children, that they are looking after their children. If they have
to move down to the south-west [of Western Australia], it is quite a complex
thing. They potentially need to pay rent up here if they have a house up here
or need to say, 'Okay, I'm going away for six months; I'm going to give up that
property that I have.' They potentially need to pay something for housing in
the environment they are going to. They actually really need to shift their
entire lives, and I think that taking a young person who is probably
experiencing some mental health issues and putting them down in the south-west
at a fruit picking farm where there are not appropriate services or support for
those young people is not going to have the outcome that we need, which is that
those young people feel that they have been given skills, that they have been
supported and that they actually can move on to another job.[142]
4.121
Witnesses also noted that efforts to relocate for work were often not
attempted and where they were, they occasionally did not end well. Mr Brendan
Churchill noted the Tasmanian context:
If you are somebody who lives on the north-west coast, if you
are going to move to your next-nearest population centre, which might be
Launceston, it is difficult, because there are no guarantees you are going to
find a job. One in three between 18 and 30 in Burnie are currently
unemployed, I think it is one in four in the greater Launceston area who are
unemployed and it is one in five almost...
I know Victoria and South Australia are also experiencing
similar levels of youth unemployment, so even if they do make the jump to the
mainland there is no guarantee that this issue is resolved.[143]
4.122
Similarly, Mr Twomey of WACOSS told the committee:
If you look at the WA Treasury figures, there has been very
little interstate migration. The projections going forward have interstate
migration dropping off or even going backwards, while international migration
still continues. That is mostly around the fit of the jobs and the skills—jobs
that are available and the skills that are needed versus people coming.
Certainly, our emergency relief agencies have had stories of people who
packed up everything into their car, drove across the Nullarbor and got here
because they were told that is what they needed to do to get a job. They have
ended up in crisis because that has not come together for them. So there are
big risks and there are certainly big risks when people move away from where
they have support networks and they know people.[144]
4.123
As noted earlier, for Aboriginal and Torres Strait Islander peoples,
there are cultural issues as to why moving to an urban centre might cause dislocation
and hardship.[145]
Concluding comment and committee view
4.124
It is clear that income is a key factor in determining the economic
wellbeing of most Australians. A low income or low transfer payments will often
exacerbate the disadvantage suffered by a person and their dependants. Take the
case of a retrenched worker who may be forced to live on savings or the Newstart
allowance for a period of time. This may mean foregoing health services with
out of pocket expenses, refinancing a mortgage or ending childcare or private
school tuition for their children. A more prolonged period of unemployment may
lead to despondency, mental health problems, marital breakdown and
homelessness. The committee is very mindful that a low income resulting from
retrenchment or marital breakdown can have a significant flow-on impact on
individuals and families.[146]
Breaking this cycle can be extremely difficult.
4.125
This chapter has dealt with disadvantage of a more endemic nature. Its
focus has been on groups in Australian society that suffer from significant personal
hardship, cultural deprivation, discrimination and injustice. For people in
these groups, a low income is a symptom of these underlying circumstances.
Nonetheless, low transfer payments or a low income often compounds the
extent of the disadvantage felt by people in these groups. Coupled with the
disadvantage of a mental health condition, a physical disability or the demands
of being a single mother, a low income makes it more difficult to access decent
and stable housing, quality health and education services and the skills needed
to break out of poverty. And yet it is these assets, services and skills that
are most needed by people in these disadvantaged groups. Where they cannot be
found, they become even more susceptible to ill health and exclusion from the
labour market and society.
4.126
The committee considers that it is important to ask the question: what
would be the economic and the social gain to the individual and to the
Australian economy of providing adequate transfer payments and access and incentives
to work for people in these disadvantaged groups? In other words, if the gaps
could be closed, what would be the benefits? There have been some significant
responses to this question in recent years. In separately commissioned work,
Deloitte Access Economics has calculated that:
-
a further three per cent increase in workforce participation
amongst workers aged 55 and over would contribute an extra $33 billion to Gross
Domestic Product or around 1.6 per cent of national income, while an additional
five per cent would contribute a further $48 billion;[147]
-
closing the gap between labour market participation rates and
unemployment rates for people with and without disabilities by one-third would
result in a cumulative $43 billion increase in Australia's GDP over the next
decade in real dollar terms. The modelling also suggests that GDP will be
around 0.85 per cent higher over the longer term, which is equivalent to
an increase in GDP in 2011 of $12 billion;[148]
and
-
if the gaps in Aboriginal and Torres Strait Islander peoples life-expectancy,
employment and productivity could be closed to match those of the Australian
population, by 2031, the Australian economy would be more than 1.15 per cent
larger in real terms than would otherwise be the case. This is an additional $24
billion (in 2012–13 dollars).
4.127
Chapter 6 of this report returns to these issues in the context of New
Zealand's forward liability model.[149]
Navigation: Previous Page | Contents | Next Page