Chapter 3 - Poverty and Inequality in Australia
The existing and growing gap between the rich and the poor in
Australia is obvious to even the most ardent of sceptics.[1]
3.1
This chapter provides an overview of the nature and extent of poverty in
Australia. It provides a discussion of the origins of poverty research in Australia,
especially the work of Professor Henderson beginning in the 1960s. The chapter
then analyses recent statistics related to poverty and inequality in Australia,
including an overview of the groups most at risk of being in poverty today and
recent studies of income and wealth distribution.
The origins of poverty research
3.2
The first systematic attempt to estimate the extent of poverty in Australia
was undertaken in the mid-1960s by researchers at the Melbourne University's Institute
of Applied Economic and Social Research (IAESR). The research team, led by
IAESR Director Professor Ronald Henderson, conducted a survey of living
conditions in Melbourne and estimated the extent of poverty in Melbourne using
a poverty line based on a two-adult, two-child family set at an income equal to
the value of the basic wage plus child endowment payments. The study found that
one in sixteen of Melbourne's population was living in poverty in 1966.
3.3
The poverty benchmark in this study was chosen because of its relevance
to Australian concepts of the minimum income, and also because as a proportion
of average earnings it was similar to poverty lines used in other countries. It
was regarded by the research team as an austere measure, likely to produce
lower-bound estimates of poverty. The equivalence scale used to derive poverty
lines for other family types was, in the absence of any reliable Australian
estimates of relative needs, derived from a survey of household budgets and
costs undertaken in New York in the 1950s.
The Henderson Commission of Inquiry
3.4
Community and political pressure following the release of the 1966
survey into poverty in Melbourne led to calls for a national inquiry to
determine whether the problems highlighted in this study applied to the nation
as a whole. A Commission of Inquiry into Poverty was established in August 1972
by the Prime Minister, Mr McMahon. Professor Henderson was appointed as
Chairman of the inquiry (the inquiry was subsequently referred to as the
Henderson Inquiry). After the 1972 election the new Prime Minister, Mr Whitlam,
expanded the Commission's size and scope with specific responsibility to focus
on the extent of poverty and the groups most at risk of experiencing poverty;
the income needs of people in poverty; and issues related to housing and
welfare services. These topics were addressed in the Commission's first main
report, Poverty in Australia, released in August 1975.
3.5
The poverty line described above was subsequently used by the Henderson
Inquiry to produce the first authoritative estimates of poverty in Australia.
The information on poverty was based on data from an ABS income survey
undertaken in August 1973. The report's main focus was on identifying the
extent of poverty due to inadequate income, in the sense of being low income
relative to need. The income unit chosen was a married (or defacto) couple or
single person, with or without dependent children. A unique feature of the Henderson
poverty line was that it allowed poverty to be estimated both before and after
housing costs. After-housing costs were derived by deducting actual housing
costs from income and comparing the remaining income with a poverty line that
excluded the housing cost component.[2]
3.6
The Henderson Commission's main findings were as follows:
- Over 10 per cent of income units in 1972-73 were below the
Commission's poverty line. A further 8 per cent were defined as 'rather poor',
having an income of less than 20 per cent above that line.
- About 7 per cent of income units were below the poverty line
after housing costs were taken into account. Those renting from private
landlords were the poorest group.
- About three-quarters of those below the poverty line (before
housing) were not in the workforce.
- Overall, female sole parent families comprised the largest
proportion of very poor people.
- About one-third of the single aged were very poor before housing.
However, less than 10 percent were very poor after housing, because a large
number were home-owners.
- The group with the largest percentage gap between its income and
the poverty line comprised large families on wages on or just above the minimum
wage.
- There was significantly more poverty in rural areas on a before
housing basis. After housing, however, the difference was not as significant.
- Very few young men were voluntarily unemployed and thus below the
poverty line.[3]
Extent of poverty in Australia
3.7
There have been a number of recent studies that have attempted to
estimate the extent of poverty in Australia; however, these estimates vary
widely. Submissions to the inquiry, often drawing on these studies, have also
presented a range of estimates. A number of recent poverty estimates are
presented in Table 3.1.
Table 3.1: Poverty in Australia
– Selected Estimates
|
|
Year
|
Numbers in poverty
|
|
Henderson poverty line1
|
1999
|
3.7 – 4.1 million (20.5
– 22.6% of population)
|
|
St Vincent de Paul
Society2
|
-
|
3 million
|
|
Australian Council of
Social Service3
|
2000
|
2.5 – 3.5 million (13.5
– 19% of population)
|
|
The Smith Family4
|
2000
|
2.4 million (13 % of
population)
|
|
Brotherhood of St
Laurence5
|
2000
|
1.5 million
|
|
The Australia
Institute6
|
-
|
5 – 10% of population
|
|
Centre
for Independent Studies7
|
-
|
5%
of population in 'chronic poverty'
|
Sources:
1 Cited in Harding A
& Szukalska A, Financial Disadvantage in Australia – 1999, The Smith Family,
2000, p.38.
2
Submission
44, p.44 (SVDP National Council).
3
Submission
163, p.9 (ACOSS).
4
Harding
A, Lloyd R & Greenwell H, Financial Disadvantage in Australia –
1990 to 2000, The Smith Family, 2001, pp.5, 22-23.
5
Submission
98, p.3 (BSL).
6
Committee
Hansard
19.6.03, p.648 (The Australia Institute).
7
Submission
45, p.10 (CIS).
3.8
The table shows that the Centre for Independent Studies (CIS) has
estimated that 5 per cent of the population can be considered to be in 'chronic
poverty'.[4]
Other estimates are much higher. The Smith Family has estimated that 13 per
cent of the population was in poverty in 2000 – this had increased from 11.3
per cent since 1990.[5]
Poverty rates based on the Henderson poverty line estimate that 20.5 per cent
of the population was in poverty (after paying for housing costs) or 22.6 per
cent in poverty (before housing costs) in 1999.[6]
A study by King found that in 1996, 16.7 per cent of income units were below
the poverty line and very poor, with a further 13.7 per cent classified as 'rather
poor'.[7]
3.9
The CIS estimate of 5 per cent of the population in chronic, long term
poverty is based on a number of assumptions. These assumptions include that
half to two-thirds of those below the poverty line at any one time are
transitional; perhaps half or more are under-reporting their true income; and
including the value of government services would raise the final incomes of
lower income groups by about 50 per cent. The CIS, however, provides little quantifiable
data to support their claims and concede that their estimate of those in
poverty is a 'guesstimate'.[8]
3.10 By contrast, as
noted above, poverty rates based on the Henderson poverty line have reported
much higher estimates of poverty – up to 23 per cent of the population. Serious
concerns have been raised over how this poverty line has been updated over time
to account for changes in community incomes. It has been argued by some
researchers that updating this poverty line by increases in seasonally adjusted
household disposable income per capita grossly inflates the poverty estimates.
The Smith Family has argued that the Henderson poverty line produces a picture
of an 'ever-rising tide' of poverty because it is set at an ever-increasing
proportion of family income.[9]
3.11 ACOSS stated
that depending on the poverty lines used and taking into account housing costs
there are between 2.5 million (13.5 per cent) and 3.5 million people (19 per
cent) living in poverty in 2000, with between 800 000 and 1.3 million children
in poverty.[10]
The Brotherhood of St Laurence (BSL) estimated that even by the most cautious
estimate (using the half median income measure) more than 1.5 million people
were living below the poverty line in 2000 – 'whichever way it is measured,
this is simply too high for a wealthy country like Australia'.[11]
The SVDP National Council stated that in Australia today approximately 3
million people are poor – and 'further to this, our nation is torn by
inequality'.[12]
3.12 Recent studies
commissioned by the Smith Family on poverty in Australia have generally
reported poverty estimates midway between the figures produced by the CIS and
the Henderson poverty line. One report, Financial Disadvantage in Australia
– 1999, found that in 1999:
- One in seven Australians or 2.4 million people lived in poverty,
when the poverty line is set at half the average family income of all
Australians.
- Income poverty had declined slightly since the 1980s – 13.3 per
cent of Australians were in poverty in 1999, compared with 14.6 per cent in
1982.
- While there was a slight decline in poverty among adults during
this period, the major factor underlying this fall was a 20 per cent fall in
the poverty rate among dependent children.
- Aged persons – of all poor Australians, only nine per cent live
in a family headed by a person aged 65 years or more. On an after-housing
basis, only six per cent of all poor Australians live in households headed by
an aged person.
- Poverty mainly affects those of working age – almost one-third of
those in poverty live in families where the head is not in the labour force,
while over one quarter are in families where the head is unemployed.
- While more than half of all Australians in poverty live in
families with no adult earners, over 40 percent live in families where one or
both adults in the family works. About one-fifth of all those in poverty live
in families where both parents work.
-
Just over one half of all of Australia's poor live in families
whose main income source is government cash benefits.
-
About half of all poor people in Australia live in families that
contain children. Children living in sole parent and larger families continue
to face high poverty risks.[13]
3.13 The report
defined 'financial disadvantage' or 'poverty' in terms of a family whose income
is less than half the average family income. The study justified its use of the
'half average income' poverty line arguing that it better captures relative
deprivation in times of rising income inequality than using a figure based on
median incomes. As the top income earners become better off, then the poor are
relatively worse off. That is, they are poorer in relative terms. Using the 'half
average income' poverty line denotes acceptance of the proposition that the
living standards of the poor should be measured against the living standards of
all the population, including the very affluent.[14]
The data source for the study was the 1997-98 ABS national income survey,
updated to May 1999. Income in the study included wages and salaries, workers
compensation and superannuation, dividends and rents, income from self-
employment and child support payments.
3.14 Another study
commissioned by the Smith Family, Financial Disadvantage in Australia – 1990
to 2000, examined trends in poverty in Australia during the 1990s. The data
sources for this study were various ABS national income surveys conducted over
the 1990s. Poverty estimates based on this study are summarised in Table 3.2.
The study also contains a large collection of other data on poverty in Australia.
Table
3.2: The Smith Family – Estimated Poverty Rates 1990-2000
| (percentage of population) |
| 1990 |
1995 |
1996 |
1998 |
2000 |
|
| 11.3 |
11.7 |
12.0 |
12.6 |
13.0 |
(a) |
| 8.2 |
8.2 |
8.6 |
8.4 |
8.7 |
(b) |
- half average income poverty line
- half median income poverty line
Source: Harding A,
Lloyd R & Greenwell H, Financial Disadvantage in Australia
1990-2000, The Smith Family, 2001,
p.5.
3.15 The table shows
that poverty increased from 11.3 per cent to 13 per cent of the population over
the period from 1990 to 2000, when the poverty line is set at half the average
family income of all Australians (the study's preferred measure). In 2000
almost one in eight Australians or 2.4 million people lived in poverty. The
study pointed to the persistence of poverty despite a decade of economic
growth. The report noted that 'strong economic growth over the past decade has
not produced comparably strong social outcomes for many different groups within
Australia'.[15]
3.16 The data shows
that estimated poverty rates are sensitive to the poverty line used. As
previously noted, the Smith Family studies justify their use of the 'half
average income' poverty line on the grounds that it better captures relative
deprivation in times of increasing income inequality.[16]
3.17 The other main
findings of the study are detailed below.
- Poverty among adults increased steadily during the decade.
- Child poverty fell during the first half of the 1990s but
increased since that time.
- There was an increase in the poverty risk faced by families
dependent on government cash benefits, which increased from 24 per cent in
1990 to 31 per cent in 2000. As a result of this shift, by 2000 government
cash benefits were the main family income source for about 60 per cent of
poor Australians – up from 46 per cent in 1990.
- Unemployment was a key generator of poverty – about half of all
Australians aged 15 years and over who were unemployed lived in poverty.
Poverty increased among the unemployed in the late 1990s.
- The proportion of poor families that had wages and salaries as
their primary income source remained unchanged over the 1990s. Having a job
appeared less of a protection against poverty than in the past, with the risk
of being in poverty among all Australians aged 15 years and over and working
part time rising from 10.7 per cent in 1990 to 11.7 per cent in 2000.
Part-time work appeared to be associated with greater vulnerability to poverty
than having full-time work. For the vast majority of wage and salary earner
families, having a full time job was sufficient to ensure that the family was
not in poverty.
- The poverty rate for men was slightly higher than the poverty
rate for women, with the somewhat higher number of sole parents and older women
in poverty being offset by the large number of single men and men aged between
15 and 64 years in poverty.
- Poverty rates generally decrease with age, although for a large
part of the decade poverty among those in the 50 to 64 year age bracket was
higher than for people aged 25 to 49 or over 65 years.
- A major change during the decade has been the steady increase in
poverty rates among the aged. While the risk of being in poverty was previously
much lower for the aged than for those of workforce age, now the risk is
relatively similar. However, if poverty is assessed after housing costs have
been met a different picture emerges. For the aged, due to their high home
ownership rates, the risk of being in poverty did not change during the 1990s.
Conversely, poverty among adults aged 25 to 44 years has become more serious,
with almost one-fifth of adults aged 25 to 44 years in poverty on an
after-housing basis.
- The results by State fluctuate, and it is not clear whether the
year-to-year changes reflect real variation or sampling error for the smaller
States. NSW had the highest poverty rate in 2000, with 13.9 per cent of its
residents in poverty. Poverty also increased in the other States, with only Queensland
and Tasmania remaining relatively unchanged.
- The depth of poverty did not change greatly during the 1990s,
with the average gap between a poor family's income and the poverty line increasing
from $112 in 1990 to $118 in 2000 (after accounting for the impact of
inflation).[17]
3.18 The Centre for
Independent Studies has criticised the above Smith Family study into poverty
trends arguing that the extent and nature of poverty identified in the study
has been exaggerated.
3.19 The CIS has
three main criticisms of the study, namely:
- The study has confused poverty and inequality by adopting a
relative view of poverty, whereas most people think of poverty in absolute
terms.
- By adopting a poverty line based on mean (average) rather than
median income the study has exaggerated the extent of poverty in Australia.
- The ABS data on which the study relies are not sufficiently
reliable for conclusions to be drawn about the extent of poverty. The problems
include under-reporting of incomes especially by welfare recipients and the
self employed and the exclusion of certain sources of income, such as income in
kind and government benefits provided below cost.[18]
3.20 These arguments
have been disputed by Professor Peter Saunders of the Social Policy Research
Centre. In relation to the first argument, he has argued that while most people
think of poverty in subsistence terms, this is not the same as supporting an
absolute definition of poverty. A subsistence notion of poverty emphasises that
poverty is a situation where basic needs cannot be met, but this is consistent
with the goods and services that are required to meet those needs being defined
relatively – in the sense that they will depend on the general lifestyles,
living standards and values of the community at a particular point in time.
3.21 In regard to the
second point, Professor Saunders argues that neither the mean nor median income
alone provides information about how well needs are being met, although the
mean is preferred by some researchers because it better captures relative
deprivation in times of rising income inequality. He did concede, however, that
most poverty researchers prefer to link poverty lines to median income rather
than mean income. In relation to the third CIS argument, he argues that while
the ABS data may be unreliable there is no reliable research to support that
claim. He also argues that it is not clear what impact the inclusion of many
subsidised services would have on the distribution of income.[19]
Who is in poverty today?
3.22 Evidence to the
Committee and a range of studies into poverty and deprivation has shown that
poverty is more likely to occur among particular groups in the population.[20]
The major groups are identified in the table below and include Indigenous
Australians, the unemployed and people dependent on social security benefits.
This is not an exclusive list of those groups experiencing poverty, but serves
to identify those most commonly referred to in studies into poverty and
evidence received during the inquiry. Further discussion of poverty and
disadvantage among these groups and others is contained in later chapters of
the report.
Groups at high risk of
poverty
-
Indigenous Australians
-
people who are unemployed
-
people dependent on government
cash benefits
-
sole parent families and their
children
-
families that have three or more
children
-
people earning low wages
-
people with disabilities or those
experiencing a long term illness
-
aged people, especially those
renting privately
-
young people, especially in low
income households
-
single people on low incomes
-
people who are homeless
-
migrants and refugees.
3.23
A study by the Smith Family/NATSEM has illustrated the distribution of
poverty as indicated in the table below.[21]
Who is poor in Australia?
A Smith Family study estimated that of every 100 poor
Australians:
-
24 live in working-poor (wage and
salary) families;
-
23 live in families with an
unemployed head;
-
15 live in other families
dependent on social security;
-
14 live in sole parent families;
-
9 live in self-employed families;
-
6 live in families headed by an
aged person;
-
5 live in some other type of
family; and
-
4 live in families reliant on
superannuation and investment income.
3.24
Indigenous Australians face a far greater risk of poverty than other
Australians, and is indicated in high levels of joblessness, low levels of
formal education, poor health, inadequate housing and the experience of
dispossession and racism.[22]
The nature and extent of poverty among Indigenous people is discussed in
chapter 13.
3.25 In addition to
the groups listed above, other smaller population groups are also vulnerable to
poverty including people with drug and alcohol problems; domestic violence
survivors; people living in caravan parks; people with caring responsibilities,
including young carers; problem gamblers; recently released prisoners and some
groups whose poverty remains undocumented in any substantial way (for example
mentally ill people).[23]
One submission noted that while vulnerability to poverty occurs amongst broad
population groups it is likely that smaller population groups can experience
high levels of economic hardship where low incomes are compounded by quite
specific forms of disadvantage.[24]
3.26 Poverty is
increasingly associated with low pay. The Australian Liquor, Hospitality and
Miscellaneous Workers Union (LHMU) noted that the crisis of low pay contributes
strongly to poverty as low paid workers are often also the 'jobless poor'. Low-paid
workers tend to 'churn' through a series of low-paid jobs interspersed with
periods of unemployment – as such the unemployed and the low paid are often the
same people at different times. In addition, a large proportion of poor people
live in households with a wage earner (the wages of the low paid thus support
the poor); people who earn low pay are generally found in households which have
a low income; and low paid workers become retires – low wages project
disadvantage into the future, because low paid workers cannot adequately save
for their retirement.[25]
3.27 Poverty is also
associated with where people live. There is growing evidence of regional
disparities, with geographic concentrations of great wealth and great
disadvantage within areas of all major capital cities and between cities and
rural areas.[26]
Poverty in rural and regional communities is discussed in chapter 14.
Poverty by State/Territory
3.28 The extent of
poverty varies between the States and Territories with evidence indicating that
the smaller, less populous States generally exhibit the highest incidence of
poverty and deprivation (although the extent of poverty often varies depending
on the indicator used). Table 3.3 reproduces Smith Family data on poverty
levels in the States.
Table 3.3: Poverty levels – States and Territories (1999)a
|
|
NSW
|
VIC
|
QLD
|
SA
|
WA
|
TAS
|
NT
|
ACT
|
|
|
%
|
%
|
%
|
%
|
%
|
%
|
%
|
%
|
|
Before
housing costs
|
14.1
|
12.3
|
12.9
|
15.9
|
12.4
|
15.4
|
8.9
|
8.9
|
|
After
housing costs
|
18.1
|
15.5
|
18.6
|
18.9
|
16.2
|
18.7
|
12.4
|
12.4
|
a half
average income poverty line.
Source: Harding A & Szukalska A, Financial Disadvantage in Australia
– 1999, The Smith Family, 2000, p.17.
3.29 As the table
shows, poverty levels (on a before-housing cost basis) were greatest in South
Australia, Tasmania and NSW. Poverty levels in all the States and Territories
increased after housing costs were taken into account, although the pattern of
poverty across the States was similar. South Australia, Tasmania and Queensland
had the highest proportion of people in poverty after housing costs are
removed, while the lowest proportion was recorded in the ACT and the Northern
Territory (12.4 per cent).
3.30 ABS data show
that, in 2001, the proportion of people in 'low income' households (before
housing costs) was highest in Tasmania (27 per cent) and the Northern Territory
(25 per cent), and lowest in the ACT (11 per cent).[27]
ABS data for 2000-01 indicate that average levels of incomes varied between the
States. Three States had disposable household incomes below the national
average of $469 per week. Tasmania was the poorest State with mean weekly
income 17 per cent below the national average income level, followed by South
Australia (9 per cent below) and Queensland (6 per cent below). NSW and Victoria
both recorded incomes at 3 per cent above the national average, with Western
Australia at about the national level. The ACT recording the second highest
average income (24 per cent above the average) after the Northern Territory.[28]
3.31 Submissions and
witnesses commented on the particular features of poverty in the various
States. SACOSS noted that South Australia is a low income state with average
(mean) incomes, on both a before and after-housing basis, the lowest in the
country. High levels of poverty have been contained by the State's lower
housing costs, although this is now at risk due to a reduction in the public
housing stock.[29]
SACOSS stated, however, that the rate of poverty has doubled since the early
1980s. Rates of inequality have also doubled, but South Australia is less
unequal than the other States, which is partly due to the fact that it has
fewer high-income earners.[30]
3.32 Tasmania, like South
Australia, is a low income State, with high levels of unemployment (and low
labour force participation), low rates of pay for those employed and high
levels of part-time and casual employment. Tasmania is also a high-cost state
in terms of the 'basket' of essential goods and services required by all
households, such as food, energy and transport.[31]
Sea freight and transport charges can increase the cost of consumables relative
to those on the mainland.[32]
A further indicator of disadvantage is the high take-up of welfare payments –
some 40 per cent of Tasmanian income units rely on government pensions and
allowances.[33]
3.33 In Western
Australia, WACOSS pointed to growing levels of deprivation within the
community, noting that it is the most geographically vast and isolated State in
the country and 'faces unique and complex issues' in relation to poverty,
especially related to its remoteness, high living costs and the problem of
poverty amongst Indigenous communities.[34]
3.34 In Queensland
the geographical differences in poverty and disadvantage were highlighted.
Submissions and other evidence noted that poverty is particularly concentrated
in a number of regions such as parts of the Cape and Gulf regions – both areas
with large Indigenous populations, certain regional centres and areas on the
urban fringe.[35]
QCOSS indicated that poverty in Queensland has risen steadily from the 1980s to
the mid 1990s, with poverty rates almost doubling during that period – 'of
great concern is that poverty rates in Queensland have been and continue to be
consistently high in comparison with national rates and in comparison with
other states and territories'.[36]
3.35 In Victoria,
VCOSS pointed to the growing disparity in income levels between regional/rural
areas and metropolitan areas and specific areas within metropolitan centres.[37]
3.36 In the Northern
Territory, NTCOSS indicated that the level of poverty in the Territory is
often hidden and that on all indicators the Territory has the highest level of
poverty of any State or Territory. NTCOSS commented that poverty is influenced
by remoteness, a large Indigenous population, geographical distances with a
small population spread over a large area and high population mobility which
poses challenges in providing adequate physical and social infrastructure.
These factors also impose additional costs for those living in the Territory.[38]
Income inequality
3.37 Studies into
trends in income inequality over recent decades and submissions to the inquiry
point to increasing income inequality in Australia. As the Salvation Army noted
'strong economic growth over the last decade has not resulted in the highly
anticipated emergence of strong social outcomes for many Australians'.[39]
3.38 Studies into the
distribution of both earnings and of income have shown increasing
inequality. In relation to earnings, studies have found increasing inequality since
the 1980s. An ABS study concluded that inequality in the distribution of wage
and salary earnings of full-time adult employees increased in the 1980s and
that this trend continued through the 1990s.[40]
Another study by Professor Saunders found that the inequality in full-time wage
and salary earners incomes, as measured by the Gini coefficient, increased from
0.224 in 1990, to 0.271 in 1994-95 to 0.275 in 1999-2000.[41]
Analysis by FaCS confirmed these trends. The Department stated that there has
been increasing dispersion of earnings since 1979, with the top percentiles
recording stronger growth than the bottom percentiles. Since the mid 1980s
three trends were evident:
- between 1985 and 1990, earnings at the bottom fell almost
continuously in real terms, while those at the top remained stable after an
initial fall;
- between 1990 and 1996, earnings at the bottom initially rose, but
then remained stable, while those at the top consistently increased in real
terms; and
- between 1996 and 2000 earnings grew at all points, although more
rapidly at the top of the earnings distribution.[42]
3.39 Earnings
distribution statistics reflect the impact of the market on the distribution of
economic rewards. A more complete picture is provided by taking into account
the impact of government tax and transfer (social security) programs. By
assessing the impact of these programs it is possible to determine the
distributional impact of social security benefits and the impact of income taxes
on the distribution of income.
3.40 As noted above,
income distribution statistics, which take into account the impact of the
tax-transfer system, show a trend towards increasing inequality in Australia.
This is indicated in recent ABS statistics as detailed in Table 3.4.[43]
3.41 As the table
shows, one measure of the spread of incomes across the population is indicated
by the percentile ratios. The P90/P10 ratio shows that in 2000-01, the top 10
per cent of households received 3.97 times the income of the bottom 10 per
cent. This ratio has increased from 3.77 in 1994-95, thus showing increasing
inequality over the period 1994-95 to 2000-01.
[44]
Table 3.4: Selected Income
Distribution Indicators*
|
|
1994-95
|
1995-96
|
1996-97
|
1997-98
|
1999-2000
|
2000-01
|
|
Ratios of incomes of households at top of selected
income percentiles
|
|
|
|
|
|
|
|
P90/P10 ratio
|
3.77
|
3.74
|
3.66
|
3.77
|
3.89
|
3.97
|
|
P80/P20 ratio
|
2.56
|
2.58
|
2.54
|
2.56
|
2.64
|
2.63
|
|
P80/P50 ratio
|
1.55
|
1.57
|
1.56
|
1.56
|
1.57
|
1.56
|
|
P20/P50 ratio
|
0.61
|
0.61
|
0.61
|
0.61
|
0.59
|
0.59
|
|
Income share
|
|
|
|
|
|
|
|
Lowest quintile %
|
7.9
|
8.1
|
8.3
|
7.9
|
7.7
|
7.6
|
|
Second quintile %
|
12.8
|
13.0
|
13.1
|
12.8
|
12.6
|
12.5
|
|
Third quintile %
|
17.7
|
17.7
|
17.8
|
17.6
|
17.6
|
17.7
|
|
Fourth quintile %
|
23.7
|
23.9
|
23.7
|
23.8
|
23.7
|
23.6
|
|
Highest quintile %
|
37.8
|
37.3
|
37.1
|
37.9
|
38.4
|
38.5
|
|
All
persons %
|
100.0
|
100.0
|
100.0
|
100.0
|
100.0
|
100.0
|
|
Percentage share of total income received by persons
with:
|
|
|
|
|
|
|
|
Low income (a) %
|
10.8
|
10.9
|
11.0
|
10.8
|
10.5
|
10.5
|
|
Middle income (b) %
|
17.7
|
17.7
|
17.8
|
17.6
|
17.6
|
17.7
|
|
High income (c) %
|
37.8
|
37.3
|
37.1
|
37.9
|
38.4
|
38.5
|
|
Gini
coefficient no.
|
0.302
|
0.296
|
0.292
|
0.303
|
0.310
|
0.311
|
* Equivalised disposable household income – disposable
household income adjusted on the basis of the household's size and composition.
- Persons
in the second and third income deciles.
- Persons
in the middle income quintile.
- Persons
in the highest income quintile.
Source:
ABS, Household Income and Income
Distribution, Cat. No.6523.0, July 2003, pp.10, 13.
3.42 Another measure
of income distribution is provided in the income shares going to groups of
people at different points in the income distribution. The table shows that, in
2000-01, those on 'low incomes' (that is, 20 per cent of the population in the
2nd and 3rd income deciles) received 10.5 per cent of
household income, whereas those in the 'high income' group (that is, the 20 per
cent of the population in the highest income quintile) received 38.5 per cent
of the income.[45]
The income shares of the low income group declined from 10.8 per cent to 10.5
percent of income over the period 1994-95 to 2000-01, whereas the income share
of the high income group increased from 37.8 to 38.5 per cent over the same
period. The 'middle income' group's share of income remained relatively stable.
The ABS concluded that its analysis of the latest income distribution statistics
support 'a conclusion of some increase in inequality' since 1994-95.[46]
3.43 Professor Saunders,
commenting on the ABS data, noted that since 1995-96, 47 per cent of the
total increase in income was received by those in the top quintile. He added
that 'almost half of the economy-wide increase in income generated by economic
growth under the Howard Government was of no benefit to the bottom four-fifths
of the population'.[47]
3.44 An earlier study
by Harding and Greenwell reflected these trends. The study based on ABS income
surveys found that income inequality increased between the late 1980s and the
mid-1990s and there was some evidence to suggest that this trend had continued
(which was confirmed in the ABS study cited). The increase in inequality was
driven by declines in the income shares of the bottom 10 per cent, and to a
lesser extent, the middle 20 per cent of Australians during the 1990s, and an
increase in the income share of the top 10 per cent.[48]
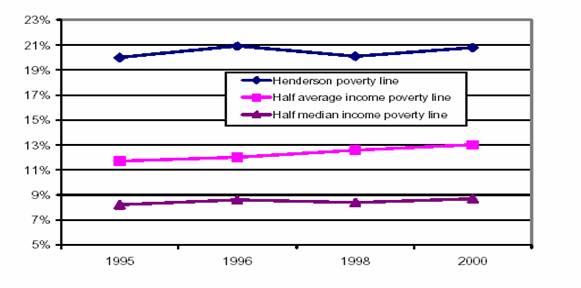
3.45
This trend towards increasing inequality was reinforced in evidence from
ACOSS. Drawing on Smith Family research, ACOSS noted that using three different
poverty lines 'all three show a gradual but significant increase in income poverty
over the late 1990s'. This is illustrated in Figure 3.1.[49]
Figure
3.1: Trends in income poverty
3.46 Not only are
income levels low for large numbers of Australians but critical expenditures on
a range of necessities have been rising at a faster rate than the level of
inflation. For example, Table 3.5 shows that since 1989-1990 the following
costs have increased.
Table 3.5: Cost Increases
|
Education
|
|
An Increase of 173 % higher
than the increase in the CPI
|
|
Health
|
|
An Increase of 98 % higher than
the increase in the CPI
|
|
Hospital
and medical
|
|
An Increase of 137 % higher
than the increase in the CPI
|
|
Dental
|
|
An Increase of 113. 5 % higher
than the increase in the CPI
|
|
Urban
Transport Fares
|
|
An Increase of 134 % higher
than the increase in the CPI
|
Source: Submission 44, p.19 (SVDP National Council).
Impact of the GST
3.47 Submissions
commented on the adverse financial impact that the GST is having on low income
groups. They noted that the costs for many products and services have
substantially increased since the introduction of the GST, especially in
relation to clothing and other necessities, utility prices, insurance, and
household services including repairs and maintenance. It was commented on that
the compensation arrangements in relation to tax cuts and pension increases for
low income households when the GST was introduced has been inadequate.[50]
3.48 FaCS advised the
Committee that information on the distributional impact of the GST on different
income groups will not be available until the release of data from the 2003-04
ABS Household Income and Expenditure Survey. This data will not be available
until late 2005.[51]
Impact of taxes, transfers and
other benefits
3.49 Studies have
shown that the trend towards increasing earnings dispersion, in particular, has
been mitigated by the redistributive impact of taxes and transfer (social
security) payments and other benefits. One study noted that in 1999-2000, for
example, social transfers reduced income inequality (as measured by the Gini
coefficient) by 22.2 per cent, while income taxes reduced it by an additional
12.1 per cent. In that year, the two main distributive instruments of the
welfare state combined to reduce income inequality generated in the market
sector by around one-third.[52]
3.50 A comprehensive
study in the Smith Family submission showed the redistributive effect of taxes,
transfers and indirect benefits. The study looked at the impact of government
cash transfers (such as pensions), income taxes, selected indirect taxes and
indirect benefits, such as health, education, housing and welfare. This study
is particularly valuable as previous studies referred to above generally exclude
the impact of indirect taxes and indirect benefits. Details of the study are
provided in Table 3.6.
3.51 The study shows
that direct cash benefits, such as the age pension and unemployment allowances,
are heavily skewed towards lower income groups. Indirect benefits, via the use
of free or subsidised social services, are also skewed towards lower income
groups but are not nearly as targeted towards lower income groups as the direct
cash benefits. In particular, the second lowest and middle income quintiles
receive higher indirect benefits than the lowest income quintile.
Table 3.6: Estimated average
value of benefits received and taxes paid by equivalent income quintile,
1998-99a
|
|
Quintile
of Equivalent Disposable Income
|
|
|
Bottom
|
Next
|
Middle
|
Next
|
Top
|
All
|
|
|
20%
|
20%
|
20%
|
20%
|
20%
|
20%
|
|
|
$ pw
|
$ pw
|
$ pw
|
$ pw
|
$ pw
|
$ pw
|
|
Direct cash benefitsb
|
252.3
|
202.4
|
68.8
|
25.5
|
6.5
|
111.0
|
|
Gross
income
|
233.6
|
440.4
|
787.4
|
1132.2
|
1826.7
|
884.8
|
|
Disposable income
|
232.7
|
418.2
|
666.3
|
899.8
|
1311.9
|
706.3
|
|
Selected
indirect benefits
|
|
|
|
|
|
|
|
-
Education
|
43.5
|
85.8
|
106.8
|
81.0
|
51.0
|
73.6
|
|
-
Health
|
92.8
|
106.2
|
87.6
|
74.0
|
61.8
|
84.4
|
|
-
Welfare
|
49.3
|
45.6
|
26.4
|
12.1
|
2.3
|
27.1
|
|
-
Housing
|
12.6
|
3.4
|
1.0
|
0.4
|
0.2
|
3.5
|
|
Total
indirect benefits
|
198.3
|
241.0
|
221.8
|
167.5
|
115.3
|
188.7
|
|
Disposable income + indirect benefits
|
431.0
|
659.2
|
888.0
|
1067.3
|
1427.2
|
895.0
|
|
Selected
indirect taxes
|
38.8
|
60.8
|
86.1
|
95.4
|
114.7
|
79.2
|
|
Final
income
|
392.2
|
598.3
|
802.0
|
971.9
|
1312.5
|
815.8
|
|
Ratio of final income to disposable
income
|
1.7
|
1.5
|
1.2
|
1.1
|
1.0
|
1.2
|
|
Average number of usual residents
|
2.0
|
2.7
|
3.1
|
2.8
|
2.4
|
2.6
|
a Disposable
income equals gross income minus income tax. Final income equals disposable
income plus indirect benefits minus indirect taxes.
b For
low-income households average cash benefits are higher than gross income
because some households have negative private incomes (eg small businesses with
losses).
Source:
Submission 172, p.36 (The Smith
Family).
3.52 The impact of
selected indirect taxes including petroleum, alcohol and tobacco taxes is also
included in the study. Such taxes are regressive, taking a greater proportion
of the income of low income households than of high-income households. Indirect
taxes paid by low-income households, for example, amount to an estimated $38.80
per week – or just under 17 per cent of disposable income. For high income
households, indirect taxes are much higher at $114.70 per week, but this
represents only 14 per cent of disposable income. 'Final income' in the study
refers to private earnings, social security cash payments, indirect benefits
such as education and health and the impact of indirect and income taxes. As
the table indicates, low income households are net beneficiaries from these
indirect benefits and taxes, with such indirect benefits and taxes increasing
final income by 70 per cent relative to disposable income. For high income
households, indirect taxes paid cancel out indirect benefits received, leaving
their disposable and final income at the same level. The study shows that the
incomes of low-income households are significantly raised after taking into
account taxes and benefits.[53]
Wealth distribution
3.53 Wealth plays an
important role in generating well-being. Not only do assets, such as
investments, generate income for households, but others, such as owner-occupied
housing, provide a flow of benefits such as reduced housing costs. In addition
assets, if liquid, can be used to smooth consumption over periods of limited
earnings, or illiquid assets can be used as a source of collateral for such
purposes. The SVDP noted that:
There can be no rational discussion of poverty without
consideration of wealth...Poverty exits against a backdrop of wealth. To
understand poverty in our community, we need also to address the environment of
wealth in which poverty is produced.[54]
3.54 Wealth is more
unevenly distributed than income and trends indicate that it is increasingly
concentrated in fewer hands in Australia.[55]
One study found that in 1967, 25 per cent of the wealth was concentrated in the
hands of just 5 per cent of the population – this had increased to 29 per cent by
1998. The wealth held by the top two quintiles grew between 1967 and 1998 while
the wealth of the bottom three declined. The study concluded that 'the trend
towards greater wealth equality from the start of the century to the 1960s did
not continue into the 1990s and may have reversed'.[56]
3.55
The estimated distribution of wealth in 2000 and projections to 2030 is
detailed in Table 3.7. The table shows that in 2000, the bottom 50 per
cent of the population held just 7 per cent of the wealth, whereas the top
one percent held 13 per cent of the wealth. The top 5 per cent of the
population held 32 per cent of the wealth. The table indicates that the
distribution of wealth will become more concentrated over the next 30 years.
The share of the bottom 50 percent is estimated to decline from 7 per cent
in 2000 to 5 per cent in 2030, while the share of the top 10 per cent
is projected to increase from 45 per cent to 50 percent over the same period.
Table 3.7: Estimated distribution of wealth by
selected percentiles, 2000-2030
|
Wealth Percentile
|
2000
|
2010
|
2020
|
2030
|
|
|
%
|
%
|
%
|
%
|
|
Top 1%
|
13.9
|
11.7
|
11.8
|
11.7
|
|
Top 5%
|
31.6
|
29.2
|
30.9
|
32.7
|
|
Top 10%
|
45.3
|
43.1
|
46.1
|
49.5
|
|
Top 20%
|
64.0
|
62.7
|
66.4
|
70.0
|
|
Bottom
50%
|
7.0
|
6.7
|
5.7
|
4.9
|
Note:
'Wealth' refers to the value of owner
occupied housing, equities, rental investment property, superannuation and
interest-bearing deposits.
Source: Kelly S, 'Simulating Future Trends in Wealth Inequality',
Paper presented at the 2002 Australian Conference of Economists, October 2002,
p.12.
Conclusion
3.56 Evidence
presented to the Committee and recent studies provide a profoundly disturbing
picture of the extent of poverty and deprivation in Australia. While the
numbers of those living in poverty varies between studies, even the most
conservative estimates point to substantial numbers of people in material deprivation,
struggling to make ends meet and largely excluded from social and economic
participation in the wider society. Those most at risk of poverty today cover a
wide range of groups living in various circumstances and spread throughout the
country – ranging from Indigenous Australians, the unemployed, sole parent
families, people on low wages and young people.
3.57 Evidence to the
inquiry and specialist reports have also highlighted a trend towards increasing
income and wealth inequalities in Australia. Statistics indicate that the
dispersion of earnings and income have become more unequal in Australia,
especially since the 1980s. While the impact of taxes, transfers (social
security payments) and other benefits, such as education, health and welfare
has resulted in some redistribution of income, inequality remains unacceptably
high in this country.
3.58 The wider
society must now face the consequences of increasing levels of poverty and
disadvantage in this country. In succeeding chapters the Committee has outlined
a series of strategies to address the persistence of poverty and deprivation in
this country that sadly co-exists amid affluence and general material
prosperity – a prosperity that has failed to be adequately shared by all
Australians.
Navigation: Previous Page | Contents | Next Page