Chapter 7 - Impact of state and local government charges
7.1
The three tiers of government levy taxes and charges on the construction
and sale of homes (and some of these taxes interact with each other). Concerns
have been expressed that some of these, particularly those levied by some state
and local governments, are adding unduly to the cost of buying a home,
especially for first home buyers. This chapter considers the role of stamp
duties, developer infrastructure charges, levies on rezoned land, land tax and the
interaction with the GST.
Stamp duties
7.2
The state and territory governments levy stamp duties (also known as
'transfer duty' or 'contracts and conveyancing duty') on the purchase of homes,
at varying rates and with varying concessions. It is generally equivalent to
around 3–4 per cent of the average house price in the capital cities. Some
examples of the stamp duty levied in each state, as at June 2008, are shown in
Table 7.1. In 2006–07 stamp duties raised $13 billion.[1]
Table 7.1: Stamp duty
for residential property sales at selected prices
|
|
$250 000
|
$250 000
(first homebuyers) |
$500 000 |
$500 000 (first homebuyers) |
$750 000 |
$750 000 (first homebuyers)
|
|
NSW
|
$7 240 |
- |
$17 990 |
- |
$29 240 |
$29 240 |
|
Victoria
|
$9 310 |
$8 870 |
$25 660 |
$21 790 |
$40 070 |
$40 070 |
|
Queensland
|
$7 225 |
- |
$15 975 |
- |
$18 105 |
$18 105 |
|
WA
|
$8 200 |
- |
$20 700 |
- |
$34 200 |
$34 200 |
|
SA
|
$8 955 |
$15 |
$21 330 |
$21 330 |
$35 080 |
$35 080 |
|
Tasmania
|
$7 550 |
$3 550 |
$17 550 |
$17 550 |
$27 550 |
$27 550 |
|
ACT
|
$7 500 |
$20 |
$20 500 |
$20 500 |
$34 875 |
$34 875 |
|
NT
|
$5 357 |
- |
$21 428 |
$8 413 |
$34 625 |
$21 609 |
Source:
Derived from various state and territory government's revenue office websites.
The data reflect changes in the states' 2008–09 budgets.
7.3
These duties may affect first home buyers more than other buyers, as the
major factor constraining many from entering the market is gathering sufficient
funds to meet the upfront costs. Other than the deposit, the largest of these
costs is stamp duty. The ACT government has responded to this concern by
allowing first home buyers to defer the duty for up to five years.
|
Box 7.1: Stamp duty concessions for first home
buyers in Australian states and territories
Western Australia: first home buyers are exempt from paying stamp
duty on homes priced up to $500 000 and vacant land priced up to $300,000.
New South Wales: eligible first home buyers exempt from paying
stamp duty on homes priced up to $500,000 and for vacant land priced up to
$300,000.
Queensland: as of 1 September 2008,
eligible first home buyers are exempt from stamp duty for purchases up to $500,000
for established homes.
South Australia: scaled stamp duty concessions for properties valued
at $250 000 and under.
Tasmania: those eligible for the First Home Owners Grant are
also eligible to receive a maximum stamp duty concession of $4000 for the
purchase of owner occupied property up to $350 000.
Victoria: stamp duty concession is available for the
purchase of principal places of residence priced between $115 000 and $500 000.
First home buyers are now able to claim the First Home Bonus and the
stamp duty concession.
Northern Territory: first home buyers purchasing a property priced up
to $385,000 are exempt from stamp duty. The 2008–09 budget introduced a
change in stamp duty tax rates, which now range from 1.5 per cent to 4.95 per
cent with an increase in the top rate from properties valued at $500,000 to
those valued at $525,000. For contracts executed (signed) on or after 20 June 2005, a
rebate of up to $2500 off the stamp duty payable is available.
ACT: scaled stamp duty concession scheme for properties
valued below $390 000 (applies to all home buyers).
Source: 2008–2009 State Budget Papers; State Revenue
Office websites http://www.mortgageworldaustralia.com.au/first_home_buyers/stamp_duty_concessions.htm
|
7.4
Stamp duty adds to transaction costs, which has many adverse impacts. It
impedes labour mobility. It also discourages people from moving to more
appropriate housing types as their circumstances change.[2]
It may also mean that first home buyers will seek to avoid incurring these
transaction costs again when upgrading to a larger home as their income grows
or they have children. This may lead them to buy a larger home than they need
at the time as their first home.[3]
For these reasons, it is generally regarded as an inefficient tax. It is also a
relatively volatile revenue source, fluctuating with the cycles in the housing
market. The Productivity Commission argues that governments need to consider
how best to reduce reliance on stamp duties 'in favour of more efficient
alternative sources of revenue'.[4]
7.5
The extent to which stamp duty increases more than proportionately with
increases in house prices is illustrated in the chart below.
Chart 7.1
Stamp duty as % of
house price
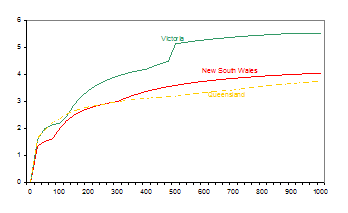
Source: derived from schedules
in NSW Treasury Office of Financial Management (2007, pp 15-16).
7.6
This has led to stamp duty payable rising relative to incomes. The cost
of stamp duties has been increasing. As the Reserve Bank has commented:
State governments have not materially adjusted stamp duty
thresholds as house prices have risen. As a result, the average rate of stamp
duty payable on the median-priced house has increased substantially, both
relative to house prices and average incomes.... [and] stamp duty concessions
given to first-home buyers have not kept pace with the increase in prices.[5]
Chart 7.2
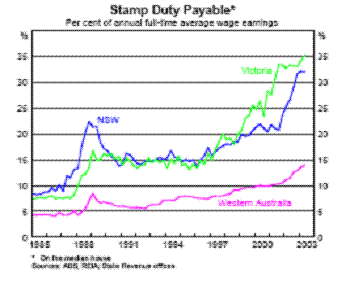
Source: Reserve Bank of Australia (2003,
p. 34).
7.7
This 'bracket creep' has been criticised within the real estate industry.
A common refrain is that 'stamp duty should be immediately indexed to median
house prices to avoid taxation creep as house prices inflate over time'.[6]
7.8
The Real Estate Institute of Australia expressed its clear opposition to
stamp duties:
A new intergovernmental agreement is required to consider means
by which inefficient property taxes, such as land tax and stamp duties on
residential property conveyancing, can be abolished or at least much reduced.[7]
7.9
Its priority in removing stamp duties is:
first home buyers purchasing a medium priced home should be
exempt from all stamp duties. State and territory governments should also
consider granting a one-off stamp duty exemption for retirees who are
downsizing their primary residence.[8]
7.10
This issue of the need for better incentives for retirees to downsize
their residence was discussed by the St Vincent de Paul Society. It was
critical of current tax arrangements which discourage 'empty nesters' from
downsizing because the cash generated from the asset sale disqualifies many on
middle incomes from the pension.[9]
In private correspondence to the committee, the Society noted:
For empty nesters one possible suggestion is that the social
security systems' income and asset test not include the income that is realised
in the sale of a property when empty nesters are downsizing. If this were not
considered in theory it would facilitate the opening up of housing stock for
younger families.[10]
Recommendation 7.1
7.11
The committee recommends that all state and territory governments consider
stamp duty exemptions for first home buyers and for retirees who are downsizing
their primary residence.
7.12
Professor Julian Disney told the committee that there needs to be a
reduction of stamp duty 'at the front end'.[11]
While he did not elaborate to the committee, Professor Disney made the
following observation in March 2008 on the SBS television program Insight:
...I would drop or substantially reduce stamp duty
at the front. Let people get into housing more easily than they can now, but
then when they've got in and they're starting to enjoy the benefits of housing,
ask them to contribute on the way through.[12]
7.13
Other proposals came from Professor Burke and Associate Professor Hulse.
In their submission to the inquiry, they recommended three possible options for
reforming stamp duty. First, the impost could be switched from purchasers to
sellers, thereby excluding first home buyers. Second, stamp duty could still be
applied to purchasers but the scales could be reformed to provide (further)
relief at the more affordable end of the market. Their third
proposal is to hypothecate a percentage of stamp duty explicitly for an
affordable housing fund or an infrastructure fund.[13]
7.14
Forming a view about these possible reforms to stamp duties requires
information about who ultimately bears the duty. There were some submissions
that suggested removing stamp duties may just allow vendors to raise prices.[14]
Infrastructure charges
7.15
A few decades ago it was common for new housing developments only to
have the most rudimentary infrastructure. Sealed roads, sewerage and facilities
such as parks and libraries—sometimes even water and electricity—were only
provided some years after new building blocks were sold and homes built on
them. They were gradually provided and paid for out of general rates and
taxation revenue.
7.16
Now it is more common for such infrastructure to be installed as the
land is developed.[15]
Rather than funded by the whole community through taxes and rates, it is
increasingly being funded, especially in New South Wales, by specific 'infrastructure
charges' on developers, who may in turn pass the charges on in the form
of higher prices for serviced lots and homes.
7.17
To the extent they are ultimately borne by new home buyers, infrastructure
charges raise equity questions about who should pay for infrastructure—the
general community or those most directly benefiting. There is also a question
of timing of the charges—how much of the payment for infrastructure should home
buyers make at the time of purchase and how much over the years.
7.18
The Real Estate Institute of Australia argues that:
There should be a specific review with a view to reducing this
component cost of new housing developments and spreading those development
costs across the broader community, as they were back in the 1950s and 1960s.[16]
7.19
Some laud the infrastructure charges as improving efficiency by
introducing 'user pays' principles. A counterargument is that it is only
current users that are paying, not future users (as is the case when
infrastructure is funded through borrowings repaid over time by taxes and
rates).
7.20
Another argument for infrastructure charges is that they enable more
land to be developed quickly than if the cost of infrastructure had to be borne
by financially constrained local governments. While the Planning Institute of Australia
'recommends that a consistent national approach be taken to developer
contributions'[17],
they see them as more transparent than alternative funding measures:
They are intended to be transparent forms of appropriately
apportioning the cost of infrastructure provision, whereas in the past, prior
to developer contribution schemes or infrastructure charging schemes, there
were a lot of underhanded ways in which money was collected from developers to
provide infrastructure. It was not open and accountable. In fact, in many cases
the money that was taken from a developer, presumably for infrastructure in one
location, was actually spent in another location and not for the same type of
infrastructure.[18]
7.21
Others argue the charges are excessive and contribute significantly to
making housing less affordable, especially for first-home buyers. Some argue
they lead to 'gold plating', excessively expensive infrastructure being
mandated by councils no longer needing to fund it from their own resources. As Professor
Troy told the committee:
I would...argue that we are very generous about what we do with
road supplies. We put them in to high standards, and one of the reasons why we
do is that now that we have the developer paying for it the local authority can
say, ‘We want an eight-inch paving because we don’t want to carry the
maintenance costs, and we’re going to make sure it is gold plated.’[19]
7.22
Another criticism is that infrastructure charges are levied as a flat
rate, rather than being related to the value of housing:
If we were trying to put an affordable housing development on
Pine Rivers with small-lot workers cottages at $300 000, a $60 000
infrastructure charge would be out of the question. The people up the hill were
providing $600 000 houses. A charge of $60 000 is much more able to be
accommodated by a large house with five bedrooms and three bathrooms than by a
workers cottage. If we are going to steer the industry better, we have to have
progressive fees and charges.[20]
7.23
The case for a developer charge is weaker when it is for facilities that
will benefit the broader community rather than just those moving into a new
estate. An extreme example provided to the committee is:
Hornsby Shire Council levied an extra $1100 a block for the
construction and maintenance of a library. I have nothing against community
libraries, but the argument there in terms of policy is: should only a few
homeowners pay for that or should that be a broader community responsibility.[21]
7.24
The Productivity Commission argue this is unusual:
As a general rule in local government, developer contributions
can only be used to fund specific infrastructure investments, and cannot
therefore be used to subsidise other services to the community.[22]
7.25
As a guide to the magnitudes, the following four tables show
estimates from various studies. Table 7.2 compares the cost components for a
new house in 2003 in Penrith (an outer western suburb of Sydney) and Wyndham (a
suburb of Melbourne).
Table 7.2: Components
of cost of a new home
|
$'000 (%)
|
Penrith |
Wyndham |
|
Land
|
93 (22%) |
42 (14%) |
|
Infrastructure charges
|
65 (15%) |
32 (11%) |
|
Planning and building fees
|
5 (1%) |
1 (0%) |
|
Dwellings
|
156 (36%) |
139 (48%) |
|
Margins
|
61 (14%) |
46 (16%) |
|
Tax
|
53 (12%) |
31 (11%) |
|
Total
|
431 (100%) |
291 (100%) |
Source:
Productivity Commission (2004, p. 160).
7.26
More recent data from the UDIA refer to the edge of Sydney today.
Table 7.3: Components
of cost of a new home in outer Sydney
|
|
$'000 (%) |
|
Electricity
|
5 (1%) |
|
Sydney water
|
10-15 (2-3%) |
|
Local council section 94 contribution
|
45 (9%) |
|
State levy for infrastructure
|
30 (6%) |
|
GST
|
40 (8%) |
|
Land/dwelling/margin/other
|
365-370 (73-74%) |
|
Total
|
500 (100%) |
Source:
Mr Woodcock,
Urban Development Institute of Australia, Committee Hansard, 1 April 2008, pp 76–77.
Further examples were provided by the UDIA's New South Wales
Division and the Property Council.
Table 7.4: Components
of cost of a new home in Camden, outer Sydney
|
|
$'000 (%) |
|
Land
|
59 (11%) |
|
Development works
|
57 (10%) |
|
Finance costs
|
26 (5%) |
|
Selling costs
|
8 (1%) |
|
Dwelling
|
192 (35%) |
|
State levies and taxes
|
57 (10%) |
|
Council levies and fees
|
33 (6%) |
|
GST
|
40 (8%) |
|
Margins
|
75 (14%) |
|
Total
|
551 (100%) |
Source:
Urban Development Institute of Australia (NSW Division), Additional material supplied to
committee, 1 April 2008.
Table 7.5: Components
of cost of a new home, 2006
|
$'000
|
Sydney
south-west |
Hunter
(NSW) |
Gold Coast |
Melbourne |
Adelaide |
Perth |
|
Land / margins
|
376 |
266 |
294 |
275 |
192 |
285 |
|
GST
|
48 |
32 |
33 |
32 |
22 |
33 |
|
State infrastructure
|
18 |
5 |
0 |
0 |
0 |
0 |
|
Other state taxes
|
75 |
46 |
49 |
54 |
32 |
55 |
|
Section 94 infrastructure
|
26 |
11 |
15 |
5 |
2 |
0 |
|
Other local government
|
1 |
1 |
1 |
1 |
0 |
1 |
|
Total
|
544 |
361 |
392 |
367 |
248 |
374 |
Source:
Property Council (2007).
7.27
These data need to be interpreted carefully. The tables may give the
impression that the final price results from adding a set of independently‑determined
components. However, it should not be assumed automatically that developer
charges are passed on to homebuyers. They may instead be (partly) borne by the
developer, or be 'passed back' in the form of a lower price being paid by the
developer for the raw land. The committee heard a range of views on this
question.
7.28
The building industry generally suggest charges are passed on:
things are then levied against the development industry, and of
course they simply pass that on to the first home buyer in particular.[23]
7.29
Some see the chain as longer, but also ending with the home buyer:
cost shifting by all levels of government—the feds to the state,
to the local level, to the developer—a misnomer—who passes it on to the
homebuyer.[24]
7.30
However, some argue that developers who want to have such charges
reduced have a vested interest in portraying the charges as an impost on
homebuyers. One developer said that prices are set in the market for
established dwellings and new developments have to match that; 'the established
market is what drives the price point that you are trying to achieve'.[25]
That would imply that a higher infrastructure charge could not be passed on to
buyers in the form of a higher price. Either the developer would have to accept
a lower profit, or offer a lower price for the raw land. This does not mean, of
course, that developer charges can be increased without limit. If developers'
profits are squeezed beyond a certain point, they will leave the business. If
the price they are willing to pay for land is driven down too low, then it will
not be sold to them and may remain as farmland. This would lead to a reduction
in the supply of new housing in the outer urban area and a rise in prices
there.
7.31
The Local Government Association of Queensland's submission suggests
that infrastructure charges in that state are far from preventing developers
making good profits:
During the housing boom over the past four years...the development
industry's key players in Queensland...have recorded significant financial
growth, including a doubling in market capitalisation and an average return on
investment of 20 per cent.[26]
7.32
One academic's view of the literature is that:
there is not a direct flow-on relationship between
infrastructure levies and house prices. That has been established, based on
international research.[27]
7.33
The Productivity Commission took a similar view, leading them to
conclude that:
Greater use of upfront developer charging is unlikely to have
any substantial effect on housing affordability.[28]
7.34
A planner's view is that the tax burden is shared out:
we do not accept that all developer levies are passed forward to
the consumers of land and housing, and certainly research undertaken has shown
that generally it is the case that it is shared amongst land sellers, developers
themselves and the ultimate consumers.[29]
7.35
The Urban Research Centre suggests 'the exact fraction of the tax that
is passed forward or passed back will depend on the state of the housing
market'.[30]
In the present market, a higher than usual proportion might be expected to be
borne by homebuyers.
7.36
There is also debate about whether purchasers of homes in areas where
there has been an infrastructure charge benefit significantly, or even at all,
from lower rates and other charges in later years. The home buyer may benefit
from the home being worth more due to the better facilities funded by the
infrastructure charges.
7.37
It seems a widely held view that infrastructure charges are higher in
NSW than elsewhere.[31]
However, independent data on this does not appear readily available.[32]
If it is the case, it raises the question of why this is occurring. One
possibility is that NSW local governments have been (more) restricted from
raising revenue to pay for infrastructure by caps placed on increases in local
government land rates by the state government. This hypothesis gets some
support from the data in Table 7.6, which show that local governments in NSW
raise less revenue per head than those in other states. The Productivity
Commission found 'rate pegging has dampened the revenue raised from rates in New
South Wales'.[33]
Table 7.6: State and
local government taxes per person: 2006-07
|
|
State government |
Local government |
|
New South Wales
|
$2 598 |
$406 |
|
Victoria
|
$2 282 |
$488 |
|
Queensland
|
$2 073 |
$489 |
|
Western Australia
|
$2 777 |
$486 |
|
South Australia
|
$2 073 |
$531 |
|
Tasmania
|
$1 527 |
$445 |
|
Australian Capital Territory
|
$2 781 |
n.a. |
|
Northern Territory
|
$1 744 |
$299 |
Source:
derived from ABS, Taxation Revenue 2006-07, cat. No. 5506.0; 2008 Yearbook.
7.38
In October 2007 the NSW Government announced changes to state and local
infrastructure contributions, aimed at ensuring that they only recover the cost
of the infrastructure needed to allow development to proceed. In April 2008 an
exposure draft bill was tabled which specifies issues, including housing
affordability, that must be considered by councils when developing contribution
plans.[34]
7.39
If infrastructure charges are thought to form an excessive burden on
home buyers, and they are not due to inefficient or extravagant behaviour by
local councils, then a possible solution is for local government to have access
to another growth tax.[35]
An alternative is for councils to fund infrastructure through borrowings repaid
over time by rates, which may require rate caps to be removed to assure lenders
that councils can repay those debts.
Rezoning windfalls
7.40
When land outside the urban fringe is rezoned from rural to urban, its
value can increase significantly. The owner of the land often reaps a windfall
gain from the decision of the planning authority. This could be in the order of
$300 000 to $400 000 per hectare.[36]
7.41
The landowner may no longer be a longstanding farming family but a
property speculator:
land speculation on the urban fringe is rife, with many entities
engaging in land acquisition solely for the purpose of capturing betterment
rather than for engaging in bona fide development.[37]
7.42
It was put to the committee that there is a strong case for capturing
this gain for the use of the community. One method would be some form of
explicit 'betterment levy' on the landholder. This idea was strongly supported
by Geelong City Council:
the community is entitled to capture a proportion of any uplift
in land values which it creates as a result of the need to meet a public policy
objective.[38]
7.43
This 'development licence fee' is conceptually distinct from an
infrastructure charge, but in practice a higher infrastructure charge may be an
indirect way of capturing this windfall gain.[39]
7.44
An alternative way of capturing the windfall is for the government to
acquire the land from the farmer, paying a fair margin over its value as rural
land, but nowhere near its value as urban land. A government agency can then
resell the land to a developer at the higher price, or a government agency can
develop the land itself and make a significant profit. An example of agencies
operating along these lines was the Australian government's Land Commission
Program in the 1970s and four states have such agencies now, although their
operations have been wound back.
7.45
It is a decision for government how it uses the profits generated by the
agency. They could be used to provide infrastructure and services or reduce the
cost of housing by replacing other charges such as stamp duties. At present
state governments do not guarantee that profits from land development agencies
are necessarily used for improving housing affordability. If guaranteeing this
was felt necessary, the profits of the agency could be hypothecated to this
end.
7.46
Another option for the government agency is to forego a large profit
from the rezoning and rather make the developed land available to homebuilders
at a low price, as a way of providing affordable housing.
7.47
The government needs to make clear to a land development agency whether
its goal is to maximise profits or to provide cheap land to homeowners. It must
realise that an agency charged with maximising profits, like a private company,
will often find it worthwhile to sit on land and only release it gradually so
as to keep up the price. Confusion about the role of the land development agency
seems to have been a problem in Western Australia.[40]
Goods and services tax
7.48
Views differ about whether this should be regarded as an Australian
government or state government tax. The GST is applied to the construction of
new housing (but not to sales of existing housing). Tables 7.3 and 7.4 suggest
it is of a similar magnitude to (other) state and local government taxes. The
UDIA's NSW division regards the GST as 'the largest single impediment to the
supply of new dwellings'.[41]
7.49
The application of GST to stamp duty (and other taxes and charges) is criticised
by the UDIA as 'a tax on a tax'.[42]
Their NSW division argues that just as raw land value is not taxed, but is
deducted from the sale price to calculate the base for the GST, 'using the same
logic, all state and local government taxes should be considered part of the
land cost and removed from the GST margin'.[43]
They are given some support by the Productivity Commission, who argue that if
stamp duties are retained, 'tax-on-tax anomalies involving stamp duties would
then need to be addressed'.[44]
Land taxes
7.50
State governments impose land taxes, but exempt the principal place of
residence. Table 7.7 shows the situation as at November 2007.
Table 7.7: Land tax:
payments and marginal rates at selected values of land
|
$'000 |
NSW
|
Victoria
|
Queensland
|
Western Australia
|
South Australia
|
Tasmania
|
ACT
|
|
50 |
0
|
0
|
0
|
0
|
0
|
$325; 0.55%
|
$300; 0.6%
|
|
100 |
0
|
0
|
0
|
0
|
0
|
$463; 0.55%
|
$890; 0.89%
|
|
500 |
$2,356; 1.6%
|
$800; 0.2%
|
0
|
$375; 0.15%
|
$1,770; 0.7%
|
$4,838; 2%
|
$3,859; 1.4%
|
|
1,000 |
$10,356; 1.6%
|
$3,480; 0.8%
|
$5,875; 1.45%
|
$1,876; 0.75%
|
$11,420; 3.7%
|
$16,088; 2.5%
|
$11,925; 1.59%
|
|
5,000 |
$74,356; 1.6%
|
$79,980; 2.5%
|
$62,500; 1.25%
|
$48,375; 1.55%
|
$159,420; 3.7%
|
$116,088; 2.5%
|
$75,128; 1.59%
|
|
Primary residence
|
exempt, unless owned by company
|
exempt
|
exempt or deductible
|
exempt, unless owned by company
|
exempt
|
exempt
|
exempt, unless owned by company
|
Source: Derived from NSW
Treasury Office of Financial Management (2007, pp 32-3).
7.51
The Productivity Commission argue that land taxes are more efficient
than stamp duties because they are:
...comprehensive taxation of the unimproved value of land at a
relatively low rate, annually or more frequently...[and as] the supply of
unimproved land is inelastic, a broad land tax is unlikely to significantly distort
land use or building and housing choices.[45]
7.52
Increasing use of land tax also has the characteristic that it can make
use of the land valuations already used for local government rates. Higher land
tax may encourage investors to build houses on vacant land. A number of
submissions favoured its wider use.[46]
7.53
One witness argued that the higher impost of land tax for each rental
property owned is a strong disincentive to increase the supply of rental
housing. Commenting on Western Australia's system of land tax, he argued that
it:
...militates strongly against people having rental properties.
There is a system in this state, and it is similar in other states, that is a
regressive regime: the more properties you have the higher the rate in the
dollar. So it is accumulated. In WA the maximum rate is, I think, eight or 10
times higher than the minimum rate. So if you are an investor and you want to
own 10 properties, you are going to pay a whole lot more land tax—not just 10
times as much; you might pay 30 times or 40 times as much land tax as someone
who has just got one. So it really does work against companies setting out with
an ambition of owning a large number of rental properties. When you think about
it, it is a very artificial way to impose a tax and it has a very adverse
impact.[47]
7.54
Land tax on investment properties was criticised by the Real Estate
Institute of Tasmania:
As a result, there is little or no incentive to buy rental
properties, certainly to provide affordable housing, as this again diminishes
your return from the investment or investments, particularly the more you have.
I know a number of investors who have ditched their investment properties as a
result of increases they cop from land tax alone.[48]
7.55
A contrasting view was put by the ACT 's Affordable Housing Steering
group, who concluded:
The introduction of land tax in 1991 had no discernible effect
on the level of investor activity in the ACT's residential property market.
There is no evidence that land tax is having a measurable effect on market
behaviour.[49]
Navigation: Previous Page | Contents | Next Page