Posted 02/07/2015 by Robert Dolamore
The global financial crisis (GFC) sparked a sovereign debt crisis in a number of Euro area countries, most notably Greece, Spain, Italy, Portugal and Ireland. This flagpost uses data from the International Monetary Fund’s (IMF’s) World Economic Outlook database to look at the impact of the crisis on these Euro members and their public finances. The data shows the Greek economy contracted by much more than the other Euro area periphery economies. Despite this, Greece’s fiscal consolidation since the crisis began compares favourably with that of Spain, Italy and Portugal. Whatever the ‘rights and wrongs’ of the current impasse, Greece has undertaken significant fiscal retrenchment to try and turn things around. Nevertheless, the outlook for Greece is bleak. Given the weakness of its economy and the size of its public debt burden there are likely to be many more years ahead of painful adjustment. This is true whether or not Greece remains a member of the Euro area.
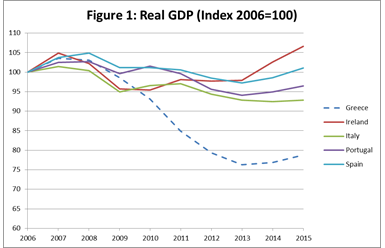
The Greek economy contracted by more than a quarter in real terms between 2008 and 2013 (Figure 1). None of the other Euro area periphery economies experienced a shock of this order of magnitude. Portugal experienced the next sharpest contraction of around 8.3 per cent.

Source: International Monetary Fund, World Economic Outlook Database: April 2015, accessed 30 June 2015.
The magnitude of this negative shock to the Greek economy would have put its public finances under severe pressure. As the Greek economy contracted the amount of tax collected would have fallen as corporate profits and taxpayers’ incomes fell. At the same time, on the expenditure side, there would have been increased pressured for spending on unemployment benefits and other social outlays. For example, the unemployment rate in Greece increased by more than the other Euro area periphery economies, rising from 7.8 per cent in 2008 to a peak of 27.5 per cent in 2013. Spain experienced the next largest increase in its unemployment rate, which rose from 11.3 per cent in 2008 to a peak of 26.1 per cent in 2013.
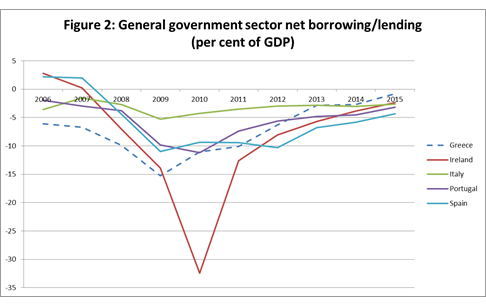
The IMF publishes a number of measures that provide a way of comparing Greece’s fiscal consolidation since the crisis began to that of the other Euro periphery economies. One measure is general government sector net borrowing/lending balance, which is a measure of a country’s overall fiscal balance (Figure 2). The data shows Greece went into the crisis running a larger budget deficit as a percent of GDP than the other Euro area periphery economies. Greece’s budget deficit reached -15.2 per cent of GDP in 2009. The IMF estimates that Greece's deficit was -2.7 per cent of GDP in 2014. This represents fiscal consolidation over this five year period of around 12.5 per cent of GDP. Over this period Greece’s fiscal consolidation was larger than that of Spain, Italy and Portugal.

Source: International Monetary Fund, World Economic Outlook Database: April 2015, accessed 30 June 2015.
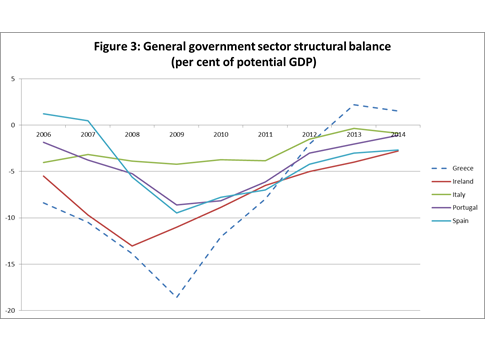
The IMF also publishes estimates of the general government sector structural balance (a deficit, in these countries) as a percentage of potential GDP. The structural balance excludes the effects of the economic cycle and non-structural elements such as temporary financial sector and asset price movements and one-off revenue and expenditure items. Potential GDP is a measure of the level of output that can be achieved without any upside or downside pressure on inflation.
This measure shows that Greece went into the crisis running a larger structural deficit as a percentage of GDP than the other Euro area periphery economies (Figure 3) — and that the size of Greece’s fiscal consolidation since 2009 has been larger than these other economies. Given the size of the contraction in the Greek economy this would suggest Greece has made a considerable effort to turn around its public finances. Nevertheless, with general government sector net debt of around 174 per cent of GDP in 2014, Greece continues to face a difficult period of adjustment ahead.

Source: International Monetary Fund, World Economic Outlook Database: April 2015, accessed 30 June 2015.