Questions 1991–2011


| |
Number of questions placed on notice |
Number of questions without notice+ |
Question time held on (number of sitting days) |
Average daily number of questions without notice |
| 1991 |
1221 |
1900 |
83 |
22.9 |
| 1992 |
896 |
1713 |
76 |
22.6 |
| 1993* |
957 |
1181 |
53 |
22 |
| 1994 |
970 |
1702 |
80 |
21.3 |
| 1995 |
783 |
1464 |
75 |
19.5 |
| 1996* |
373 |
1469 |
62 |
23.7 |
| 1997 |
641 |
1757 |
74 |
23.7 |
| 1998* |
568 |
1176 |
52 |
22.6 |
| 1999 |
1434 |
1671 |
72 |
23.2 |
| 2000 |
1392 |
1572 |
69 |
22.8 |
| 2001* |
675 |
1050 |
49 |
21.4 |
| 2002 |
1054 |
1236 |
54 |
22.9 |
| 2003 |
1439 |
1333 |
58 |
23 |
| 2004* |
1000 |
1030 |
47 |
21.9 |
| 2005 |
1149 |
1069 |
53 |
20.2 |
| 2006 |
1497 |
1111 |
56 |
19.8 |
| 2007* |
527 |
737 |
38 |
19.4 |
| 2008 |
1210 |
1050# |
51 |
20.6 |
| 2009 |
1304 |
1368 |
48 |
28.5 |
| 2010* |
837 |
1052 |
37 |
28.4 |
| 2011 |
1132 |
1453 |
53 |
27.4 |
* Indicates an election year
+ Includes supplementary questions
# On 24 November 2008 the format of question time was changed to allow 2 supplementaries per question
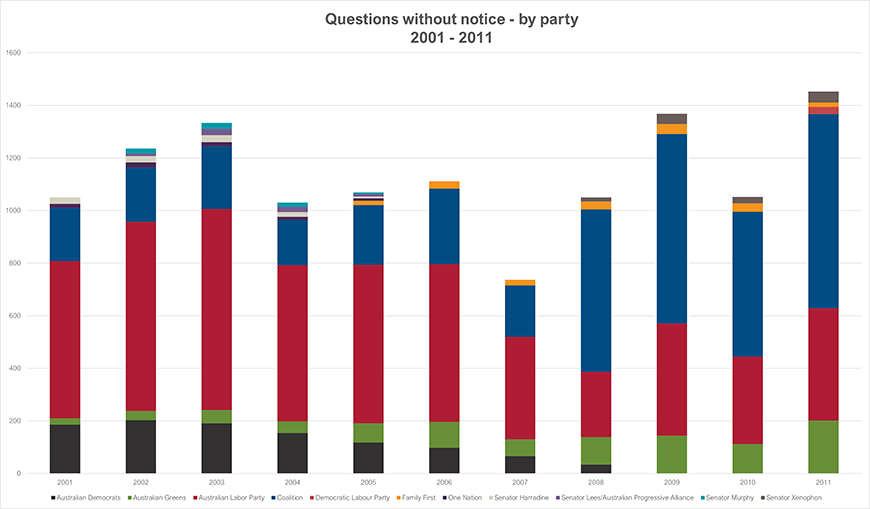
| |
Australian Democrats |
Australian Greens |
Australian Labor Party |
Coalition |
Democratic Labour Party |
Family First |
One Nation |
Senator Harradine |
Senator Lees/Australian Progressive Alliance |
Senator Murphy |
Senator Xenophon |
Total |
| 2001* |
186 |
24 |
598 |
201 |
– |
– |
16 |
25 |
0 |
– |
– |
1050 |
| 2002 |
203 |
35 |
719 |
206 |
– |
– |
20 |
24 |
10 |
19 |
– |
1236 |
| 2003 |
191 |
50 |
765 |
238 |
– |
– |
16 |
27 |
24 |
22 |
– |
1333 |
| 2004* |
154 |
44 |
594 |
172 |
– |
– |
12 |
18 |
20 |
16 |
– |
1030 |
| 2005 |
118 |
73 |
603 |
227 |
– |
16 |
10 |
6 |
10 |
6 |
– |
1069 |
| 2006 |
98 |
98 |
600 |
287 |
– |
28 |
– |
– |
– |
– |
– |
1111 |
| 2007* |
66 |
64 |
390 |
195 |
– |
22 |
– |
– |
– |
– |
– |
737 |
| 2008 |
34 |
104 |
249 |
617 |
– |
30 |
– |
– |
– |
– |
16 |
1050# |
| 2009 |
– |
144 |
426 |
721 |
– |
38 |
– |
– |
– |
– |
39 |
1368 |
| 2010* |
– |
112 |
332 |
551 |
– |
33 |
– |
– |
– |
– |
24 |
1052 |
| 2011 |
– |
201 |
427 |
739 |
27 |
17 |
– |
– |
– |
– |
42 |
1453 |
* Indicates an election year
+ Includes supplementary questions
# On 24 November 2008 the format of question time was changed to allow 2 supplementaries per question