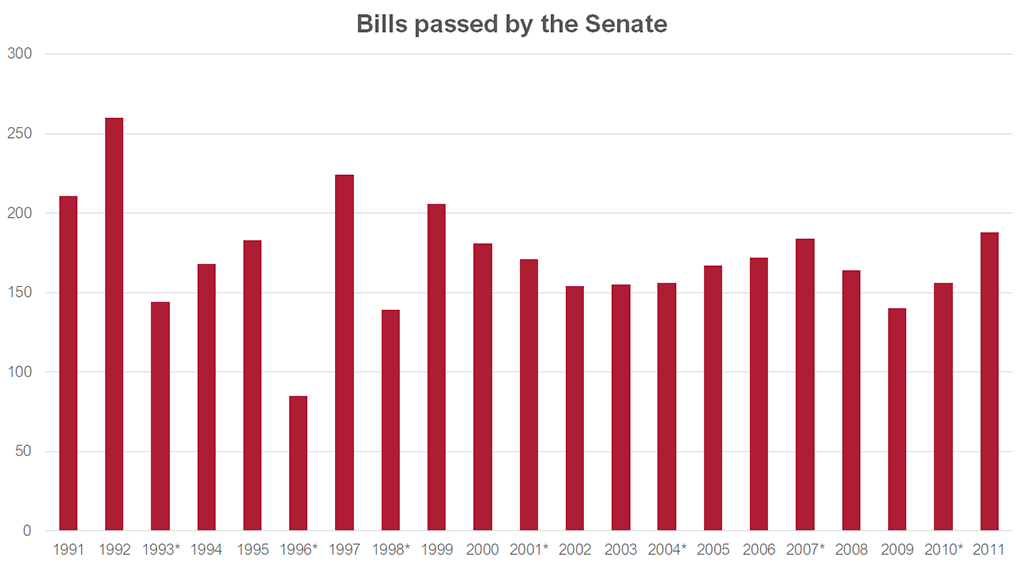
Legislation—general 1991–2011
| |
1991 |
1992 |
1993* |
1994 |
1995 |
1996* |
1997 |
1998* |
1999 |
2000 |
2001* |
2002 |
2003 |
2004* |
2005 |
2006 |
2007* |
2008 |
2009 |
2010* |
2011 |
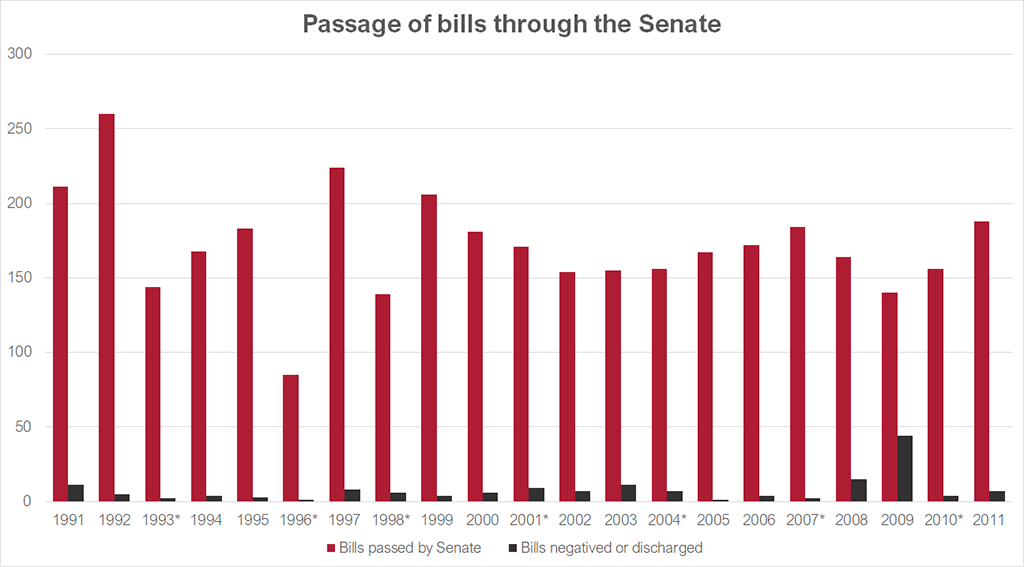
| Bills passed by Senate |
211 |
260 |
144 |
168 |
183 |
85 |
224 |
139 |
206 |
181 |
171 |
154 |
155 |
156 |
167 |
172 |
184 |
164 |
140 |
156 |
188 |
| Bills passed by Senate then laid aside or discharged by Reps |
3 |
3 |
1 |
5 |
2 |
2 |
6 |
3 |
0 |
0 |
0 |
3 |
2 |
0 |
0 |
0 |
0 |
1 |
0 |
0 |
0 |
| Bills discharged from Senate Notice Paper |
10 |
3 |
0 |
0 |
2 |
1 |
1 |
4 |
2 |
0 |
0 |
2 |
2 |
0 |
0 |
4 |
2 |
2 |
3 |
0 |
4 |
| Bills negatived by Senate |
1 |
2 |
2 |
4 |
1 |
0 |
7 |
2 |
2 |
6 |
9 |
5 |
9 |
7 |
1 |
0 |
0 |
13 |
41 |
4 |
3 |
| Number of amendments moved to adoption of committee report+ |
0 |
0 |
0 |
0 |
0 |
5 |
7 |
6 |
5 |
8 |
4 |
2 |
1 |
1 |
2 |
1 |
0 |
2 |
4 |
1 |
0 |
| Agreed to |
- |
- |
- |
- |
- |
2 |
5 |
4 |
2 |
4 |
2 |
0 |
0 |
1 |
0 |
0 |
- |
2 |
1 |
1 |
- |
| Number of bills on which there were disagreements between the Houses |
10 |
7 |
10 |
14 |
10 |
4 |
23 |
7 |
15 |
19 |
12 |
12 |
25 |
23 |
8 |
1 |
1 |
10 |
9 |
5 |
0 |
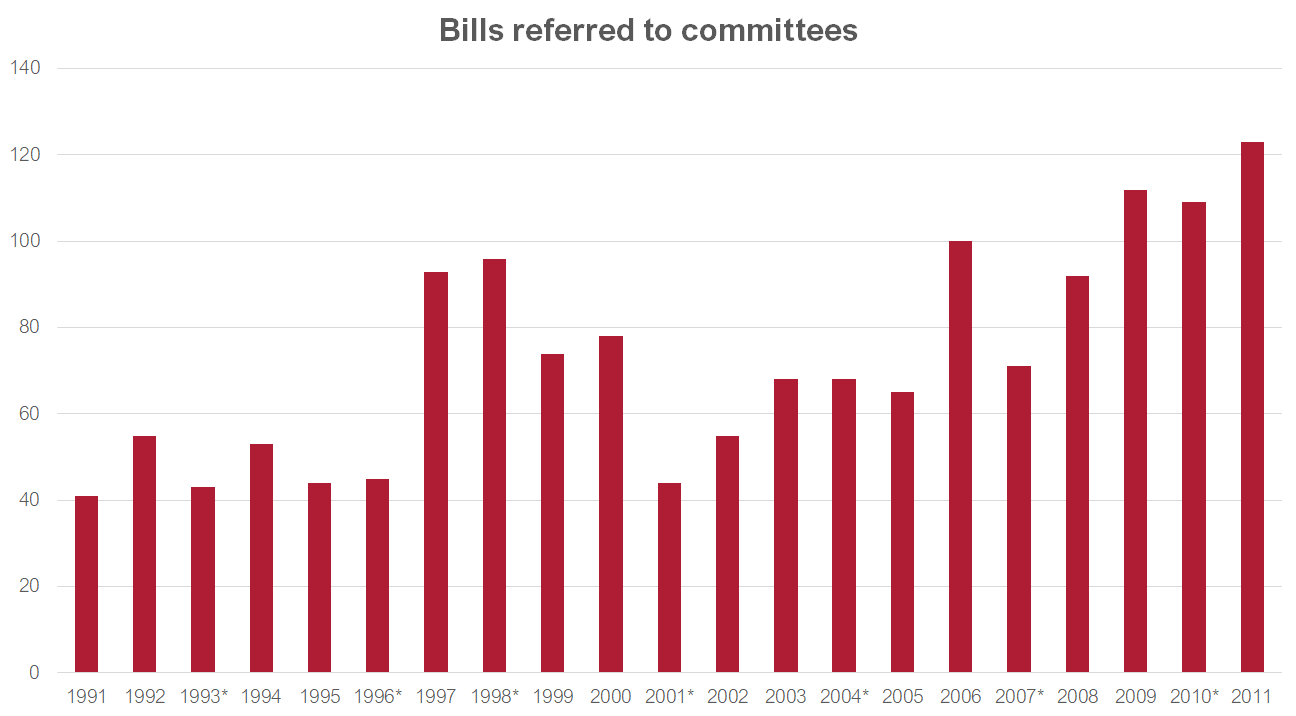
| Number of bills referred to Senate committees |
41 |
55 |
43 |
53 |
44 |
45 |
93 |
96^ |
74 |
78 |
44 |
55 |
68 |
68 |
65 |
100 |
71 |
92 |
112 |
109 |
123 |
* Indicates an election year
+ When all matters referred to a committee have been consideed, the chairman shall be directed to report to the Senate. Resolutions reported from a committee may be agreed to or disagreed to by the Senate, or agreed to with amendments. (See Senate Standing Order 148)
^ This figure includes 10 bills which were referred in both the 38th and 39th parliaments.