Proportion of time spent according to the type of business 1991–2011
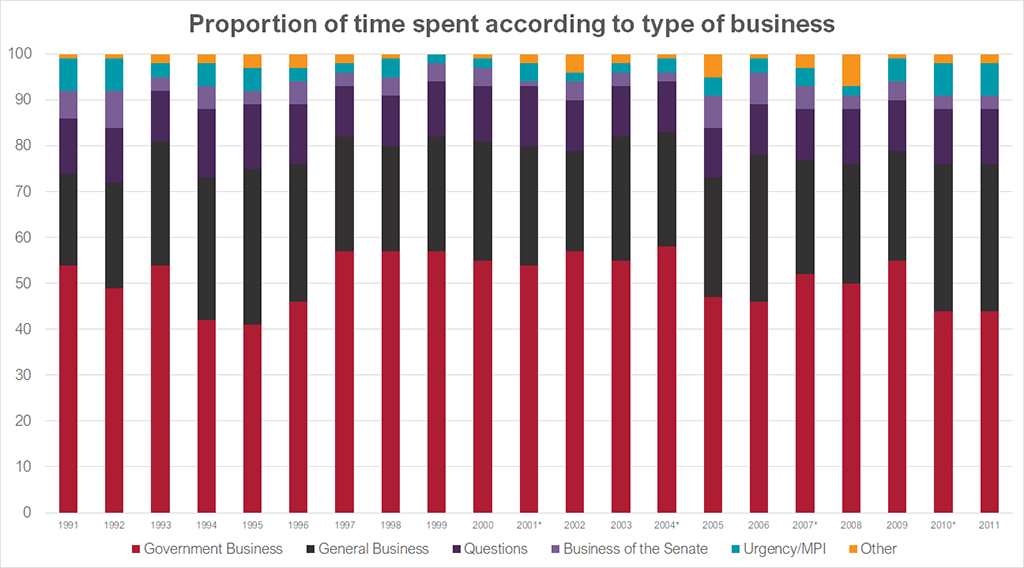
| |
Government business
(%) |
General business
(%) |
Questions
(%) |
Business of the Senate
(%) |
Urgency/MPI
(%) |
Other
(%) |
| 1991 |
54 |
20 |
12 |
6 |
7 |
1 |
| 1992 |
49 |
23 |
12 |
8 |
7 |
1 |
| 1993* |
54 |
27 |
11 |
3 |
3 |
2 |
| 1994 |
42 |
31 |
15 |
5 |
5 |
2 |
| 1995 |
41 |
34 |
14 |
3 |
5 |
3 |
| 1996* |
46 |
30 |
13 |
5 |
3 |
3 |
| 1997 |
57 |
25 |
11 |
3 |
2 |
2 |
| 1998* |
57 |
23 |
11 |
4 |
4 |
1 |
| 1999 |
57 |
25 |
12 |
4 |
2 |
0 |
| 2000 |
55 |
26 |
12 |
4 |
2 |
1 |
| 2001* |
54 |
26 |
13 |
1 |
4 |
2 |
| 2002 |
57 |
22 |
11 |
4 |
2 |
4 |
| 2003 |
55 |
27 |
11 |
3 |
2 |
2 |
| 2004* |
58 |
25 |
11 |
2 |
3 |
1 |
| 2005 |
47 |
26 |
11 |
7 |
4 |
5 |
| 2006 |
46 |
32 |
11 |
7 |
3 |
1 |
| 2007* |
52 |
25 |
11 |
5 |
4 |
3 |
| 2008 |
50 |
26 |
12 |
3 |
2 |
7 |
| 2009 |
55 |
24 |
11 |
4 |
5 |
1 |
| 2010* |
44 |
32 |
12 |
3 |
7 |
2 |
| 2011 |
44 |
32 |
10 |
1 |
7 |
6 |
* Indicates an election year