Macroeconomic outlook
Budget Resources
Ian Zhou
Introduction
The 2023–24 Budget’s ‘Economic outlook’ (Statement 2 in Budget
strategy and outlook: budget paper no. 1: 2023–24) provides:
- the
Australian Government’s assessment of the overall health of the Australian economy
- forecasts
of key economic parameters that reflect Australia’s likely economic conditions over
the forward estimates (2024–25 to 2026–27).
Forecasts of key economic parameters underlie many budget figures
and are used in calculating projections of government revenue and expenses. Policymakers,
investors and consumers can use the economic outlook as a guide to inform their
decisions and plans.
Domestic macroeconomic parameters
Compared with the October 2022–23 Budget, the 2023–24 Budget
forecasts for the 6 key domestic macroeconomic parameters have been revised
upwards slightly, indicating a better-than-expected outlook (Figure 1).
Figure 1: Major economic
parameters
Source: Australian Government,
Budget Strategy and Outlook: Budget Paper No. 1:
2023–24, 6.
Real GDP growth
A key indicator of a country’s economic health is its gross
domestic product (GDP), which measures the total value of all goods and
services produced within a country in a given period. Australia’s real GDP –after
adjusting for inflation – is projected to grow by 1.5% in 2023–24 and then maintain
at least a 2% per annum growth rate over the forward estimates (Budget paper
no. 1, p. 6).
GDP growth is driven by the ‘three Ps’: population,
productivity and workforce participation.
Population
The Budget forecasts total net overseas migration of 1.5 million
people between 2022–23 and 2026–27 (Federal
financial relations: budget paper no. 3: 2023–24, p. 118). Budget paper
no. 1 notes that much of this figure reflects a large temporary increase, with
net overseas migration ‘forecast to be 400,000 in 2022–23 and 315,000 in
2023–24’, followed by a return to normal migration levels from 2024–25.
The Government has attributed
the near-term increase to an influx of international students and working
holidaymakers – rebound effects from the lifting of COVID-19 pandemic
travel restrictions and the subsequent economic recovery. It further argues that
the projected post-COVID recovery in net overseas migration will contribute to restoring
long-term population growth forecasts, reinforcing Australia’s economic rebound
(Budget paper no. 1, p. 39).
Stakeholders in the business and healthcare sectors point
out a critical shortage of skilled workers in their respective industries
and argue it is crucial that skills shortages are addressed as part of the anticipated
population intake (discussed below under the ‘wage price index’ section).
On the other hand, Opposition Leader Peter
Dutton has criticised the Government’s migration policy and noted some of
the challenges regarding the impacts of population growth. In his Budget
reply, Mr Dutton argued:
The Albanese government’s big Australia approach was never mentioned
before the election, but it will make the cost-of-living crisis and inflation
worse … Over five years, net overseas migration will see our population
increase by 1.5 million people. It’s the biggest migration surge in our country’s
history, and it’s occurring at exactly the same time as a housing and rental
crisis. Australians are struggling to rent or purchase a property now … And the
government is now proposing to bring in almost 6,000 people per week, which
will make a very bad situation even worse … A coalition government will
sensibly manage migration, as we’ve done in the past, in conjunction with
proper infrastructure planning.
Prime Minister Anthony Albanese has responded that migration
forecasts were higher under the former Coalition Government. Treasurer Jim
Chalmers has asserted that ‘Peter Dutton is playing the usual divisive and
dishonest politics when it comes to population’.
The
Age’s chief political correspondent commented on 11 May:
Labor is being pulled in two directions at once. It needs the
migrant intake to sustain economic growth and prevent a recession, but it needs
to keep the number in check to keep faith with Australians who worry that population
growth is too high. It could revise the 1.5 million forecast downward over
time.
If migration does add to inflation, this
impact will potentially be felt more heavily in Queensland, due to internal
migration trends. The Budget includes an assumption that around 99,000 people
will migrate interstate from 2023–24 to 2026–27. Of these, 86,000 people are
expected to move to Queensland, mostly from NSW and South Australia (Parliamentary
Library calculations based on data in Budget paper no. 3, p. 119). This may
create distributional challenges, additional to the nationwide economic impacts
– positive and negative – of aggregate population growth.
For further detail regarding Australia’s migration program
and the evolution of population forecasts since the former Coalition
Government’s March 2022–23 Budget, see the Budget review 2023–24 article
‘Immigration’.
Productivity
Productivity
refers to how much output can be produced with a given set of inputs (labour,
capital, raw materials). Put simply, the more productive a person or a company is,
the more output they can produce with the same levels of input.
Productivity growth (as measured by labour productivity
growth rate) has been one of the key drivers of increasing living standards and
economic prosperity in Australia over the past several decades. However, Australia’s
productivity
growth has slowed down in recent years to an average of 1.1% (see Figure
2).
Figure 2: Australia’s average labour productivity growth over the past decades
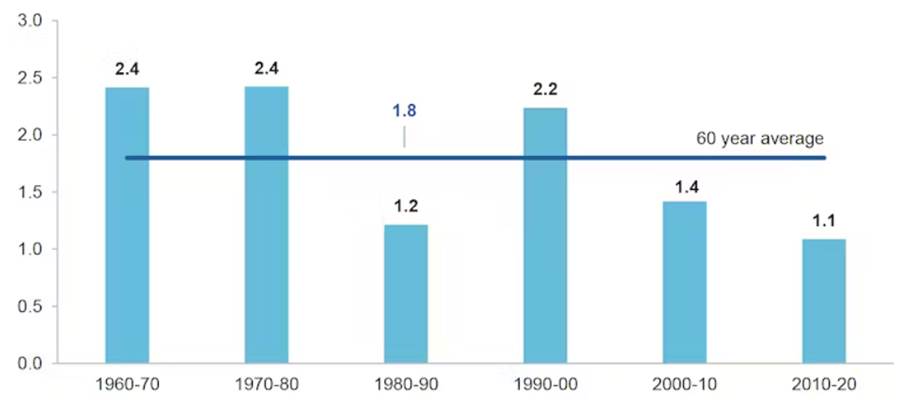
Source: John Hawkins and Craig
Applegate, ‘We know how to boost productivity and lift wages – but
it will take time and much tougher tax reform’, The Conversation, 15 June 2023.
The Treasury expresses concerns that Australia’s
productivity growth and hours worked are expected to decline further as global
warming may push up average temperatures and lead to more frequent and severe
natural disasters (Budget paper no. 1, p. 120). Consequently, the
Government says its Budget fiscal policy is designed to ‘build the capability
of our people, expand the productive capacity of our economy, and support action
on climate change’ (Budget paper no. 1, p. 87).
Business groups have argued the
Government could have done more to promote productivity growth, given the
Budget contains few specific measures to drive business investment. More policies
may emerge when the Government responds to the Productivity Commission’s 5-year
Productivity Inquiry report, Advancing prosperity, and to the parliamentary
inquiry into promoting economic dynamism, competition and business formation.
Participation
The employment-to-population ratio and the labour force participation
rate are at near record-high levels, with the latter at 66.6% in 2022–23. The
participation rate is projected to remain robust at 66.25% over the forward
estimates (Budget paper no. 1, p. 56).
This projection is underpinned by the Government’s promise
to improve women’s workforce participation and economic outcomes (Budget paper
no. 1, p. 18). The October
2022–23 Budget introduced childcare reforms intended to increase the hours
worked in paid employment by women with young children. Parenting
Payment changes announced in this Budget will enable some single parents – 91% of
whom are women – to receive the Parenting
Payment Single instead of the JobSeeker Payment, allowing them to earn more
income before losing eligibility.
Nominal GDP growth
Real GDP growth is adjusted for inflation, while nominal GDP
growth is not. As such, Australia’s nominal GDP growth is directly influenced
by swings in global commodity prices – in particular, the prices of iron ore,
coal, natural gas and agricultural commodities.
Nominal GDP is projected to grow by 10.25% in 2022–23 due to
higher-than-expected commodity prices (Budget paper no. 1, p. 6). The war in
Ukraine has exerted inflationary pressures on food and energy commodity prices
around the world, largely by
driving exceptionally strong global demand for these commodities relative
to available supply. China’s
lifting of COVID-19 restrictions has similarly increased iron ore demand
expectations and hence prices.
Australia is a commodity-exporting country and is
well-positioned to benefit from these elevated prices. Higher-than-expected commodity
prices over the past 12 months have helped to deliver a tax windfall, an
underlying cash balance surplus and strong nominal GDP growth for Australia in 2022–23.
The Treasury says it expects nominal GDP growth to decline
sharply – from 10.25% in 2022–23 to 1.25% in 2023–24 – and then remain low over
the forward estimates, partly because commodity prices are forecast to decline swiftly
to ‘long-term price levels’ (Budget paper no. 1, p. 75). For example, the
Treasury assumes the iron ore spot price will decline from a March quarter 2023
average of US$117 to US$60 per tonne in 2023–24 (Budget paper no. 1, p. 77).
Some of the assumptions are presented in Figure 3.
Figure 3: Commodity price assumptions in the 2023–24 Budget
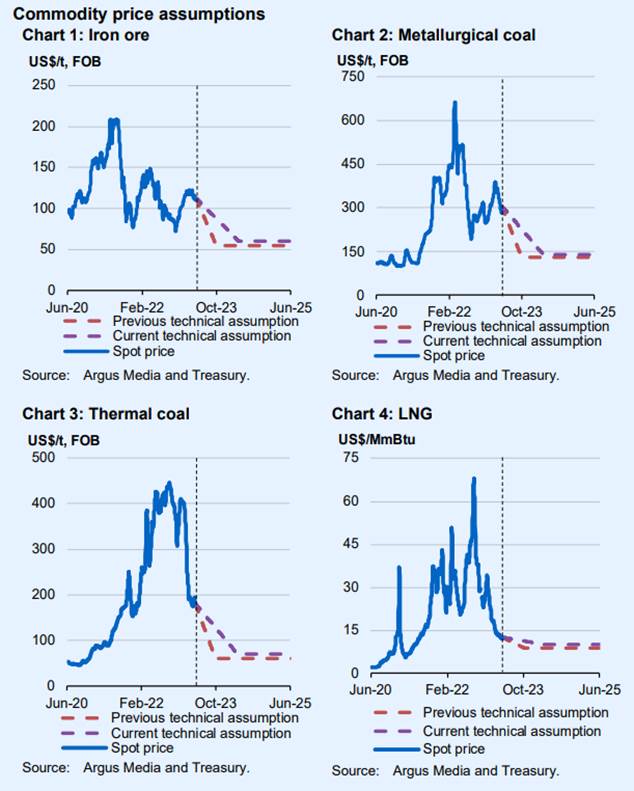
Source: Budget Paper No. 1, 77.
However, as the Australian Financial Review has
pointed out, federal and state treasuries have a long history
of underestimating commodity prices. Whatever its technical merits, this
approach does allow governments to frame the economic benefits from revising conservative
commodity price forecasts upwards as budget improvements. The Treasury
acknowledges that ‘the commodity price assumptions remain conservative and at
the lower range of market forecasts’ (Budget paper no. 1, p. 73).
Consumer price index
The consumer price index (CPI) is a widely used measure of
inflation. Rising inflation means the goods and services households buy will
cost more, increasing the cost of living: that is, the same incomes will no
longer command the same purchasing power. The Treasury believes inflation in
Australia peaked in late 2022, and that it will moderate as global price shocks
and supply constraints continue to ease. The CPI is forecast to decline from
6.0% in 2022–23 to 3.25% in 2023–24, and to less than 3% over the forward
estimates (Budget paper no. 1, p. 6).
The Reserve Bank of
Australia (RBA) has an inflation target of 2–3%. High inflation over the past 12 months has led the RBA to
pursue a contractionary monetary policy, aggressively raising its cash rate target. The Government says its fiscal policy is
designed to work in tandem with the RBA’s monetary policy to curb inflation
(Budget paper no. 1, pp. 90–91). For example, the Government has committed to
‘avoid fiscal policy adding to inflationary pressures while these are at their
highest’ (Budget paper no. 1, p. 193). The Commonwealth general government
sector was estimated to record an underlying cash balance (UCB) surplus of $4.2
billion in 2022–23. Since the Budget was released, the outlook for this surplus
has improved further, recording
a $19 billion surplus in the year-to-date to May 2023. This surplus could
be construed as a contractionary fiscal policy, where withdrawals (taxes) are
greater than injections (transfers).
Total public sector expenditure, which includes
spending by government-owned enterprises classified as ‘public non-financial
corporations’ or ‘public financial corporations’; fall
outside the ‘general government sector’ and so do not affect the UCB. Total
public sector expenditure was expected to record a negative cash deficit of
$7.8 billion in 2022–23 (Figure 4). This means that government-owned
enterprises are still injecting more money into the economy than they are
withdrawing, which, in principle, could add to inflationary pressures, and
offset some of the benefits of the UCB surplus. For example, the International
Monetary Fund (IMF) argues that fiscal policy may be carried out via
government-owned or controlled enterprises engaged in commercial activities
(IMF, Government
finance statistics manual, 2001, chapter 2, p. 6), not just via general
government sector expenditure.
Figure 4: General government sector’s underlying cash balance vs total public sector’s cash balance
Source: Budget Paper No. 1, 355–66; Australian Government Consolidated Financial Statements
Tables and Data.
The total public sector’s $7.8 billion cash deficit in
2022–23 has led commentators to question the Budget’s narrative of a
contractionary fiscal policy. For example, the Australian Financial Review’s
economics editor argued it was a ‘big
fib that the budget will take pressure off inflation and interest rates’.
He pointed out that after the small $4.2 billion surplus in 2022–23, cumulative
deficits for the general government sector over the next 4 years are forecast
to be $110 billion, with a further $59.6 billion in so-called ‘off budget’
or ‘alternative’
financing of government policies via loans and investment funds. Such a
large injection of money into the economy, he argued, ‘won’t help ease the
pressure on interest rates’. As such, while the continued strong cash inflows
to the Government in May have overshadowed the total public sector cash
deficit, it remains important to consider more than just the UCB when analysing
the complex relationship between inflation and fiscal policy.
Wage price index
The wage price index (WPI) is used to monitor changes in labour
costs over time, which can be indicative of labour market conditions. The
Government argues that the strength of recent labour market outcomes is flowing
through to wages, with nominal wage growth projected to reach 4% in 2023–24 – the
highest rate since 2009. Over the forward estimates, nominal wage growth is forecast
to remain robust at 3.25% or higher (Budget paper no. 1, p. 6).
Robust wage growth typically reflects
a tight labour market with skills shortages. Minister for Home Affairs Clare
O’Neil has stated that the Government will enable the skilled migration needed
to address skills shortages, complemented by medium and longer term efforts to
address domestic skill deficits through education, training and sectoral reforms.
(For further detail, see the Budget review 2023–24 articles ‘Immigration’
and ‘Tertiary
education’.)
Employment and unemployment
The budget papers report that strong employment growth in
Australia has kept the unemployment rate at 3.5% in 2022–23, almost a 50-year
low (Budget paper no. 1, p. 71). Unemployment rates are projected to remain low
by historical standards, rising modestly to 4.25% in 2023–24 and 4.5% in
2024–25. This offers a 2-fold
benefit to the Budget: the Government will need to spend less on welfare
transfers, and it will receive more income tax.
On the other hand, the employment growth rate is expected to
moderate as the economy slows, dropping from 2.5% growth per annum in 2022–23
to 1% per annum over the next 2 years. Despite this deceleration, the Budget
forecasts that the unemployment rate will remain low out to 2033–34, at
Treasury’s assumed Non-Accelerating
Inflation Rate of Unemployment (NAIRU) of 4.25% (Budget paper no. 1, p.
79).
The NAIRU is the lowest unemployment rate believed to be sustainable
without fuelling wage and consumer price inflation, and is factored into Treasury
and RBA policymaking.
The
Sydney Morning Herald economics editor, Ross Gittins, has questioned the
usefulness of the NAIRU as a policy guide. He has long argued the Treasury sets
the assumed NAIRU too high, leading Australia’s economic managers to accept higher
unemployment than is strictly necessary to keep inflation in check.
Furthermore, while the unemployment rate is an important
economic indicator, in isolation it does not provide a complete picture of Australia’s
labour market or the quality of jobs available.
Outlook for the global economy
Australia is a small open economy heavily reliant on trade
for its economic wellbeing. As such, the budget forecasts for Australia’s
economic health are affected by the global economic outlook.
Elevated inflation, interest rate rises and high levels of
public debt are all expected to constrain growth in advanced economies. Global
economic growth over 2023 and 2024 is projected to be the weakest seen since
the early 2000s, outside of the Global Financial Crisis and pandemic (Budget
paper no. 1, p. 43).
China’s improved outlook, following its rapid transition
from the zero-COVID policy, contrasts with these sluggish growth expectations elsewhere.
Chinese growth may prop up commodity prices and contribute to Australia’s
economic rebound over the forward estimates.
Australia’s growth is expected to exceed that of all major
advanced economies in 2023 (Budget paper no. 1, p. 43). In 2024, Treasury analysis
suggests Australian GDP growth will exceed that of the UK, the Euro area, the US
and Japan, but fall below that of China, India and the world more broadly (Figure
5).
Figure 5: GDP growth of other
countries
Source: Parliamentary Library
calculations based on Budget Paper No. 1, 44.
Sensitivity analysis and
comparisons
The Budget’s macroeconomic forecasts are underpinned by a
range of assumptions and judgements by the Treasury at the time of preparation.
Some external organisations provide their own assessments of
Australia’s economy, and alternative forecasts of major economic parameters
(Figure 6).
Figure 6: Forecasts of major
economic parameters provided by the Treasury, IMF, RBA and Deloitte Access
Economics
Source: International Monetary
Fund, Australia – Country Data; Deloitte Access Economics, Business Outlook,
March 2023; Reserve Bank of Australia, Statement on Monetary Policy – May 2023.
In practice, economic and fiscal parameters rarely evolve exactly
as forecasted. Such variations can have a significant impact on the Budget – as
noted above. Statement 8 of Budget paper no. 1 provides further information on the
confidence and sensitivity levels of the Treasury’s economic parameter
forecasts. For example, Figure 7 illustrates the range of potential outcomes modelled
for real GDP growth under different scenarios and input assumptions.
Figure 7: The range of potential outcomes modelled for real GDP growth
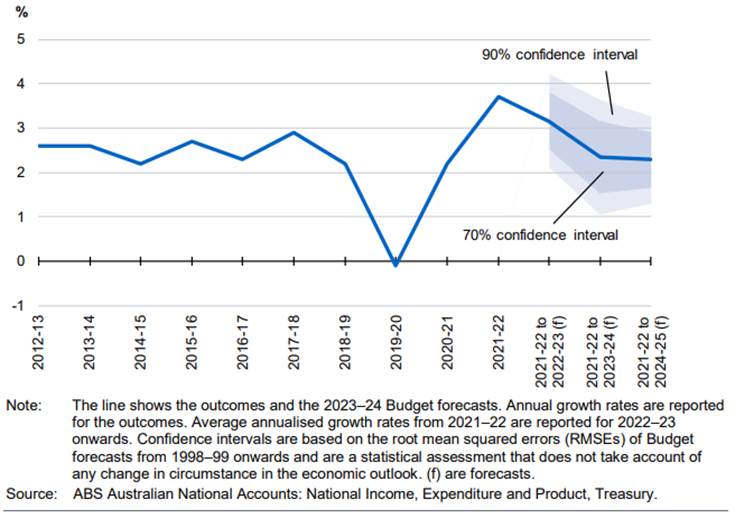
Source: Budget Paper No. 1, 268.
Deviation from the published forecasts for GDP – and other
economic parameters – will significantly affect the fortunes of future budgets,
for better or worse.