|
2001*
|
2002
|
2003
|
2004*
|
2005
|
2006
|
2007*
|
2008
|
2009
|
2010*
|
2011 |
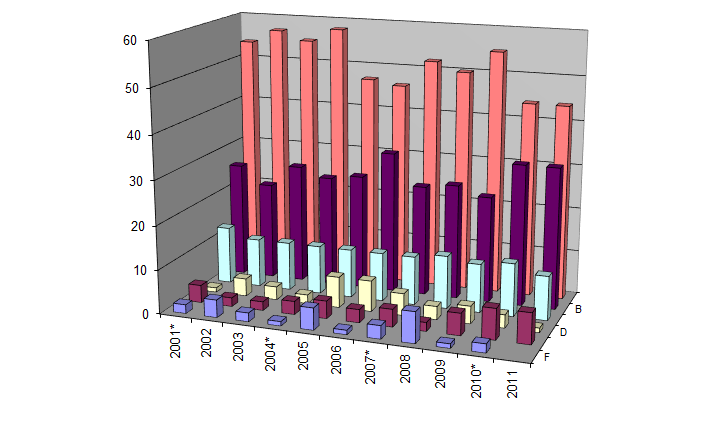
| Government business |
54
|
57
|
55
|
58
|
47
|
46
|
52
|
50
|
55
|
44
|
44 |
| General business |
26
|
22
|
27
|
25
|
26
|
32
|
25
|
26
|
24
|
32
|
32 |
| Questions |
13
|
11
|
11
|
11
|
11
|
11
|
11
|
12
|
11
|
12
|
10 |
| Business of the Senate |
1
|
4
|
3
|
2
|
7
|
7
|
5
|
3
|
4
|
3
|
1 |
| Urgency/MPI |
4
|
2
|
2
|
3
|
4
|
3
|
4
|
2
|
5
|
7
|
7 |
| Other |
2
|
4
|
2
|
1
|
5
|
1
|
3
|
7
|
1
|
2
|
6 |
All figures are in percentages
* Indicates an election year
|
Key
|
|
A)
|
Government business
|
|
B)
|
General business
|
|
C)
|
Questions without notice
|
|
D)
|
Business of the Senate
|
|
E)
|
Urgency motions/MPI
|
|
F)
|
Other business
|
|