Chapter 2
Research and Development Tax Incentive
The existing R&D tax concession
2.1
The legislative provisions that govern the existing tax concessions for
R&D are set out in sections 73B to 73Z of the Income Tax Assessment Act
1936 (ITAA 1936) and Part IIIA of the Industry Research and Development
Act 1986 (IR&D Act). These provisions, which were introduced to
encourage research and development in Australia and make eligible companies
more internationally competitive,[1]
provide concessions for particular expenditure on defined activities.
2.2
There are four elements to the existing R&D tax concession:
- a 125 per cent tax concession that provides claimants with a
deduction of 125 per cent of eligible expenditure incurred on Australian owned
R&D activities;
- an R&D tax offset that enables small companies with an annual
turnover of less than $5 million and whose aggregate Australian-owned R&D
expenditure is more than $20,000 but less than $1 million[2]
to obtain a tax offset equivalent to their tax concession entitlement;
- an incremental 175 per cent premium tax concession for those companies
that increase their R&D expenditure in Australia relative to their average
R&D expenditure over the previous three years; and
- an incremental 175 per cent international premium tax concession
available for increases in foreign-owned R&D activities carried on by a
company incorporated in Australia.[3]
2.3
Responsibility for administering the current concession is split between
the Commissioner of Taxation and the Innovation Australia Board. To access the
concession a company must have registered its R&D activities with
Innovation Australia before then completing the relevant sections of their
income tax return.[4]
2.4
The cost of the current scheme has been increasing over the past few
years as the value of R&D claimed has risen sharply (Table 2.1).
Table 2.1 – Value of
R&D claims
| |
2005-06
$mn |
2006-07
$mn |
2007-08
$mn |
|
R&D concession (not
including incremental) |
9,620 |
12,310 |
14,870 |
|
R&D incremental
concession |
820 |
1,230 |
1,250 |
|
R&D refundable tax
offset |
290 |
310 |
390 |
|
Total value of
claims |
10,730 |
13,850 |
16,510 |
Source: Australian Taxation
Office, Answers to Questions on Notice, Senate Economics Legislation Committee,
Additional Estimates, 10-11 February 2010, Question aet 36, p. 2.
2.5
The numbers of claimants under the various components of the current
scheme are shown in Table 2.2.
Table 2.2: Current
R&D tax concession scheme
| |
Estimated cost, $mn,
2009-10 |
Number of companies
registered, 2007–08 |
Reported R&D, $bn,
2007–08 |
|
125% concession |
650 |
2,986 |
4.6 |
|
Tax offset |
522 |
2,712 |
0.8 |
|
175% premium |
350 |
1,473 |
8.5 |
|
International premium |
|
7 |
0.0 |
|
combinations |
|
576 |
0.3 |
|
Total |
1,522 |
7,754 |
14.2 |
Source: derived from Innovation
Australia, Annual Report 2008-09, p. 25; information from DIISR.
2.6
The Government hopes the changes in the bill will open the incentives to
more of Australia's two million businesses:
At the moment 100 firms are getting around 60 per cent of the
total, the equivalent, in this financial [year], of $1.5 billion. The current
scheme, which was a good scheme when it was introduced, is in need of
renovation. There are going to be a lot of folk out there—the 100 firms—that
have a huge vested interest in keeping the current scheme the way it is. We are
actually in the business of helping the 8,000 firms that are currently
registered—and I would like to see a lot more firms. Given that we have two
million firms in this country, the fact that we have only 8,000 registered for
the scheme strikes me as way short of what we need to do as a country.[5]
Rationale for the proposed changes
2.7
The changes set out in the Tax Laws Amendment (Research and Development)
Bill 2010 and the Income Tax Rates Amendment (Research and Development) Bill
seek to modernise the existing incentive by cutting red tape and providing a
more targeted incentive thereby ensuring that 'public support for business
R&D is consistent with the underlying rationale for government intervention
and delivers value for money for taxpayers.'[6]
2.8
The bills currently before the parliament will achieve these stated
objectives by repealing the complex provisions that currently apply and
replacing them with a much simpler tax offset. The rate of the offset and
whether or not it will be refundable will be dependant on the entity's
turnover.[7]
2.9
Like the existing test, the offset will only be accessible where the
company involved is investing in eligible R&D activities, the definition of
which will be redefined by the passage of the Tax Laws Amendment (Research and Development)
Bill 2010.
2.10
It should be noted that the IR&D Act will continue to operate in
concert with the new Division 355 – Research and Development in the Income
Tax Assessment Act 1997 (ITAA 1997).
2.11
The after tax benefit[8]
of the different R&D concession rates over time are set out in Table 2.3.
2.12
Under the existing regime, eligible entities are entitled to claim a
deduction. The amount of the deduction is used to reduce the taxpayer's taxable
income. Under the proposed scheme, either a refundable or non-refundable offset
will be available. Offsets are applied to reduce the calculated tax liability,
therefore, if there is an excess the taxpayer is entitled to a refund unless
their turnover exceeds $20 million, in which case, the excess offset will be
carried forward to be applied against their tax liability for the next year.
Table 2.3
|
Financial year(s) |
Tax rate (%) |
Incentive rate (%) |
After tax benefit |
|
87-88 |
49 |
150 |
24.5 |
|
88-89 to 92-93 |
39 |
150 |
19.5 |
|
93-94 to 94-95 |
33 |
150 |
16.5 |
|
95-96 to 96-97 |
36 |
150 |
18.0 |
|
96-97 to 00-01 |
36 |
125 |
9.0 |
|
Current |
30 |
125 |
7.5 |
|
Ongoing (IF BILL NOT
PASSED) |
28 |
125 |
7.0 |
|
IF BILL PASSED: |
|
|
|
|
2010-11 (turnover less
than $20 million) |
30 |
150* |
15 |
|
2010-11 (turnover greater
than $20 million) |
30 |
133* |
10 |
Source: Adapted by Secretariat
from Victorian Innovation Economy Advisory Board, 2006.
*equivalent calculated under the proposed regime of a refundable tax offset.
Role of AusIndustry/Innovation Australia
2.13
Under the existing regime, the Innovation Australia Board, with the
assistance of AusIndustry officials, is responsible for registering the R&D
activities of eligible companies seeking to access the concession annually.[9]
2.14
Registration is not an indication that the activities of the company
seeking to access the concession are eligible R&D, rather entities self
assess and register. The Board then reviews registered companies through its
internal assessment process or on referral from the Tax Office.[10]
2.15
When reviewing registrations, the Board reviews the facts to determine
whether or not the facts fall within the words of the definition.[11]
2.16
Innovation Australia determines the eligibility of R&D activities;
the Tax Office considers the eligibility of R&D expenditure.[12]
The role of Innovation Australia is discussed in Chapter 7. R&D activities
and R&D expenditure are defined in Chapter 5.
2.17
The existing R&D concession regime operates in an environment of
self assessment; the Board and the Tax Office provide guidance material to
assist companies seeking to access the concessions to self assess their eligibility.
This is consistent with the broader operation of Australia's tax system.
2.18
This will not change under the amendments set out in the bills; entities
will still be required to assess their eligibility for the R&D tax
incentive under the new rules of Division 355. They will however be required to
identify, on application, both their core and supporting R&D activities.
2.19
This obligation, which will be introduced by the bill, will be
accompanied by a requirement that Innovation Australia then confirm or reject
the applicant's claim.[13]
Although the amended provisions provide for greater integrity in the
application and registration process, the explanatory memorandum to the bill
notes at paragraph 5.28 that:
As the new R&D tax incentive is a self assessment regime,
the majority of applications to the Board will be registered without formal
examination in relation to the activities conducted in the income year in
question...[14]
2.20
Guidance, and therefore a degree of certainty, will be provided to
companies through the Board's issue of public advice and advisory materials and
generalised public findings about activities.[15]
Consultation undertaken and changes made
2.21
As the following discussion and Table 2.4 shows, there have been a
number of public reviews of the scheme.
Table 2.4:
Consultations on R&D assistance
| |
Year |
No. of submitters |
No. of public hearings |
|
Productivity Commission |
2007 |
157 |
2 |
|
House of Representatives Standing Committee on Economics,
Finance and Public Administration |
2007 |
50 |
13 |
|
Cutler review, Venturous Australia |
2008 |
>700 |
9 |
|
Treasury – consultation paper |
2009 |
197 |
|
|
Treasury – first exposure draft |
2009 |
131 |
|
|
Treasury – second exposure draft |
2010 |
55 |
|
|
Senate Economics Legislation Committee |
2010 |
31 |
2 |
2.22
Following the 2009-10 federal budget announcement, the Government
commenced a consultation process in September 2009 when an initial discussion
paper was released. The Treasury received 197 submissions in response to the
release of the paper. Draft legislation was then exposed for public comment in
December 2009, the Government announcing that:
The draft legislation follows through on [the] commitment to
deliver a more generous, more predictable, and less complex tax incentive by
replacing the outdated and complicated R&D Tax Concession...[that would] help
boost the competitiveness of the Australian economy.[16]
2.23
Following that round of public comment, a revised exposure draft was
released on 31 March 2010.[17]
Final adjustments were made before the bill was introduced into the House of
Representatives on 13 May 2010.
Earlier studies
2.24
The precursor of the current scheme was introduced as part of Senator
Button's 1985 industry reforms. The programme was cut back in 1996 (Table 2.3) but
expanded again in 2001. There have since been a number of studies of the scheme
which formed the basis of the bill. The conclusions of the most recent of these
are given below.
Productivity Commission, 2007
2.25
A major study by the Productivity Commission in 2007 concluded:
The extent to which the basic R&D tax concession stimulates
additional R&D is low, particularly for large firms...Access to the 125 per
cent R&D tax concessions should be restricted to small firms.[18]
2.26
The PC attempted a cost-benefit analysis of the scheme but the results
were inconclusive, with the net benefits found to lie in a range of -$234
million to +$231 million.[19]
Department of Industry, Tourism and
Resources, 2007
2.27
The Department of Industry, Tourism and Resources issued a report
prepared by their Steven Playford, How R&D Assistance Influences Company
Behaviour: A Survey Investigating Behavioural Additionality Effects of the
R&D Tax Concession Program, in 2007. A survey of recipients of the
R&D tax concession found that 73 per cent said that they spent more on
R&D as a result of the concession.[20]
(Further information about the study is given in Chapter 3.)
House of Representatives Economics
Committee, 2007
2.28
A 2007 report by the House Economics Committee concluded:
There are doubts about the extent to which the existing
R&D tax concessions are effectively inducing additional R&D, especially
given the reduction in the company tax rate.[21]
Cutler review, 2008
2.29
The report by an expert panel chaired by Dr Terry Cutler, entitled Venturous
Australia, reviewed the national innovation system. The panel established a
specific working group to examine R&D tax concessions.
2.30
The conclusions of the panel on the R&D tax concession were:
Since its inception the R&D Tax Concession has been
subject to several problems. Instead of being tackled directly in the design
and funding of the central concession, these problems have typically been
tackled by establishing additional programs. While the Concession offers no
benefits to firms until they are in tax profit, many of Australia's most
innovative firms remain cash strapped and in tax loss for many years...Further,
the Concession is accounted for 'below the line' and so is often invisible in
company financial decision making....The International and Premium schemes should
be terminated and the basic concession increased and recast as a 40 per cent
tax credit...For small firms we propose increasing the rate of assistance
further...[22]
Henry Tax Review, 2010
2.31
The Report on Australia's Future Tax System, generally known for
its chair as the Henry Tax Review, comments:
Where the research and development of a firm generate
spillover benefits for others, the social returns from research and development
may be greater than the private returns. A tax-preference or government
expenditure that appropriately targets such spillovers may therefore be
beneficial and improve overall productivity. But where a subsidy is
inappropriately targeted, such incentives can bias the allocation of resources
in the economy and actually reduce productivity.[23]
2.32
The Report, however, cites the recent reviews of innovation
policy as a reason for it not to give detailed consideration to the matter.[24]
Committee View
2.33
In summary, the design of the new R&D assistance in the bill has
been informed by a number of inquiries with broad consultation.
Research and development in Australia
2.34
Total R&D expenditure by businesses in Australia was around $14.4
billion in 2007-08. While small business employs about half the workforce, it
only does about a tenth of R&D, which is dominated by large firms (Table 2.5)
Table 2.5: R&D by
size of firm, 2007-08 (percentage share)
|
Employment size |
|
|
Less than 4 persons |
3 |
|
5 to 19 persons |
8 |
|
20 to 200 persons |
19 |
|
Over 200 persons |
70 |
Sources: ABS, Research and Experimental Development, Business
2007-08, cat. No. 8104.0, p. 12.
2.35
About a third of R&D expenditure is on labour, with capital
expenditure only a very small element (Table 2.6).
Table 2.6: R&D by
type of expenditure, 2007-08 (percentage share)
|
Labour costs |
34 |
|
Other current expenditure |
60 |
|
Land and buildings |
1 |
|
Other capital expenditure |
4 |
Sources: ABS, Research and Experimental Development, Business
2007-08, cat. No. 8104.0, p. 12.
2.36
The majority of R&D comprises experimental development with pure
research only accounting for a very small proportion of business R&D (Table
2.7).
Table 2.7: R&D by
type of expenditure, 2007-08 (percentage share)
|
Pure basic research |
1 |
|
Strategic basic research |
5 |
|
Applied research |
32 |
|
Experimental development |
62 |
Sources: ABS, Research and Experimental Development, Business
2007-08, cat. No. 8104.0, p. 12.
2.37
Business R&D has increased relative to GDP in the past decade (Chart
2.1).
Chart 2.1: Business
R&D: per cent to GDP
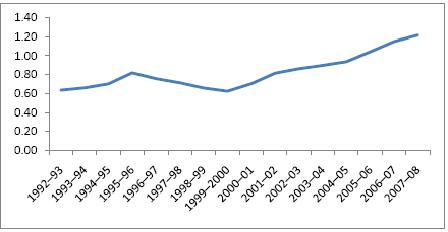
Source: derived from data in ABS 5204.0, Australian System of
National Accounts, 2008-09; and ABS 8104.0, Research and Experimental
Development, Businesses, 2007-08.
2.38
Manufacturing, mining and professional services are the largest
investors in R&D, both in absolute terms and relative to their
contributions to GDP. (Table 2.8)
Table 2.8: Business R&D
by industry, 2007-08
| |
$ bn |
% to gross value added |
|
Manufacturing |
4.3 |
3.9 |
|
Mining |
3.3 |
4.1 |
|
Professional, scientific and technical services |
2.2 |
3.2 |
|
Financial and insurance services |
1.4 |
1.2 |
|
Wholesale trade |
0.8 |
1.6 |
|
Information media and telecommunications |
0.8 |
2.3 |
|
Construction |
0.6 |
0.7 |
|
Transport, postal and warehousing |
0.2 |
0.3 |
|
Electricity, gas, water and waster services |
0.2 |
0.7 |
|
Agriculture, forestry and fishing |
0.1 |
0.4 |
|
Administrative and support services |
0.1 |
0.3 |
|
Rental, hiring and real estate services |
0.1 |
0.2 |
|
Retail trade |
0.1 |
0.1 |
|
Other services |
0.1 |
0.3 |
|
Health care and social assistance |
0.1 |
0.1 |
|
Arts and recreation services |
0.0 |
0.3 |
|
Education and training |
0.0 |
0.0 |
|
Public administration and safety |
0.0 |
0.0 |
|
Total |
14.4 |
1.4 |
Source: derived from data in ABS
5204.0, Australian System of National Accounts, 2008-09; and ABS 8104.0,
Research and Experimental Development, Businesses, 2007-08.
International comparisons of R&D assistance
2.39
An international comparison by two Treasury economists suggested that
Australia provides relatively generous tax concessions for R&D.[25]
2.40
A recent UK study has Australia ranked around the middle for its support
for corporate R&D (Chart 2.2).
Chart 2.2: Rates of
subsidy for R&D, 2007
Source: Dyson, Ingenious Britain, 2010, p. 53.
2.41
A comparison by KPMG also has Australia currently ranked in the middle
of 10 OECD economies, but moving up to first place once the new scheme is in
place (see Chapter 8).
2.42
Medicines Australia drew the Committee's attention to a comparative
study by a Canadian accountancy firm which suggests the new scheme will place
Australia in a favourable spot.[26]
The study is summarised in Table 2.9.
Table 2.9: R&D
Tax Incentives – International Comparison
| |
Started |
Benefit rate (%) |
Eligible location |
| |
|
tax deduction |
refund rate |
|
|
Australia-now |
1985 |
125 |
|
>90% in Aust. |
|
Australia-proposed |
2010 |
|
40-45 |
|
|
Austria |
1988 |
125 |
|
within EU |
|
Canada |
1986 |
|
20-35 |
>90% in Canada |
|
France |
1983 |
|
30-50 |
within EU |
|
India |
1997 |
150 |
|
in India |
|
Ireland |
2004 |
20 |
and 12.5 |
within EU |
|
New Zealand |
2008 |
|
15 |
predominantly NZ |
|
South Africa |
2006 |
150 |
|
in South Africa |
|
Spain |
1995 |
|
25 |
|
|
United Kingdom |
2000 |
130-175 |
|
anywhere |
|
United States |
1981 |
|
20 |
in USA |
Source: based on Scitax Advisory Partners, Overview of Research &
Development Tax Incentives in Selected Global Knowledge Economies, April 2010;
available at http://www.scitax.com/pdf/Scitax.International.RD.Tax.Credit.Survey.Table.08-April-2010.pdf.
2.43
A recent UK study noted the widespread use of tax incentives for
R&D:
Even countries with low corporation tax have instigated a
separate regime to encourage R&D investment. For example, Ireland lowered
its corporation tax to 12.5% in 1998 but followed that with a new R&D tax
credit in 2004. Similarly, Singapore has a twin policy of low corporation tax
rates supplemented by an attractive R&D tax credit system. The swell of
investment in France highlights how countries with high corporation tax rates
can stimulate investment with the intelligent use of tax credits.[27]
Navigation: Previous Page | Contents | Next Page