The United Nation’s theme for International Women’s Day is ‘Count her in: Invest in women. Accelerate progress’. This theme focuses on strengthening women’s economic inclusion through providing the tools and opportunities to participate in economic decision-making. Women’s economic empowerment assists to close gaps in pay, industry employment, occupation choices and transitional pathways, while their higher workforce participation generally leads to better health, education, and political outcomes. This article summarises key employment and business statistics for women (15 to 64 years unless otherwise noted), their involvement in agriculture, health status, civic and community participation. This article does not attempt to compare women to men, but rather focuses on the different outcomes for selected groups of women.
Women’s employment
In Australia in 1981, about half (49%) of all women were employed; forty years later this figure is just above 70%[1]. However, women do not experience uniform rates of employment as shown in Chart 1.
Chart 1 Employment rates of women (15 to 64 years) by selected characteristics, Australia, 2021
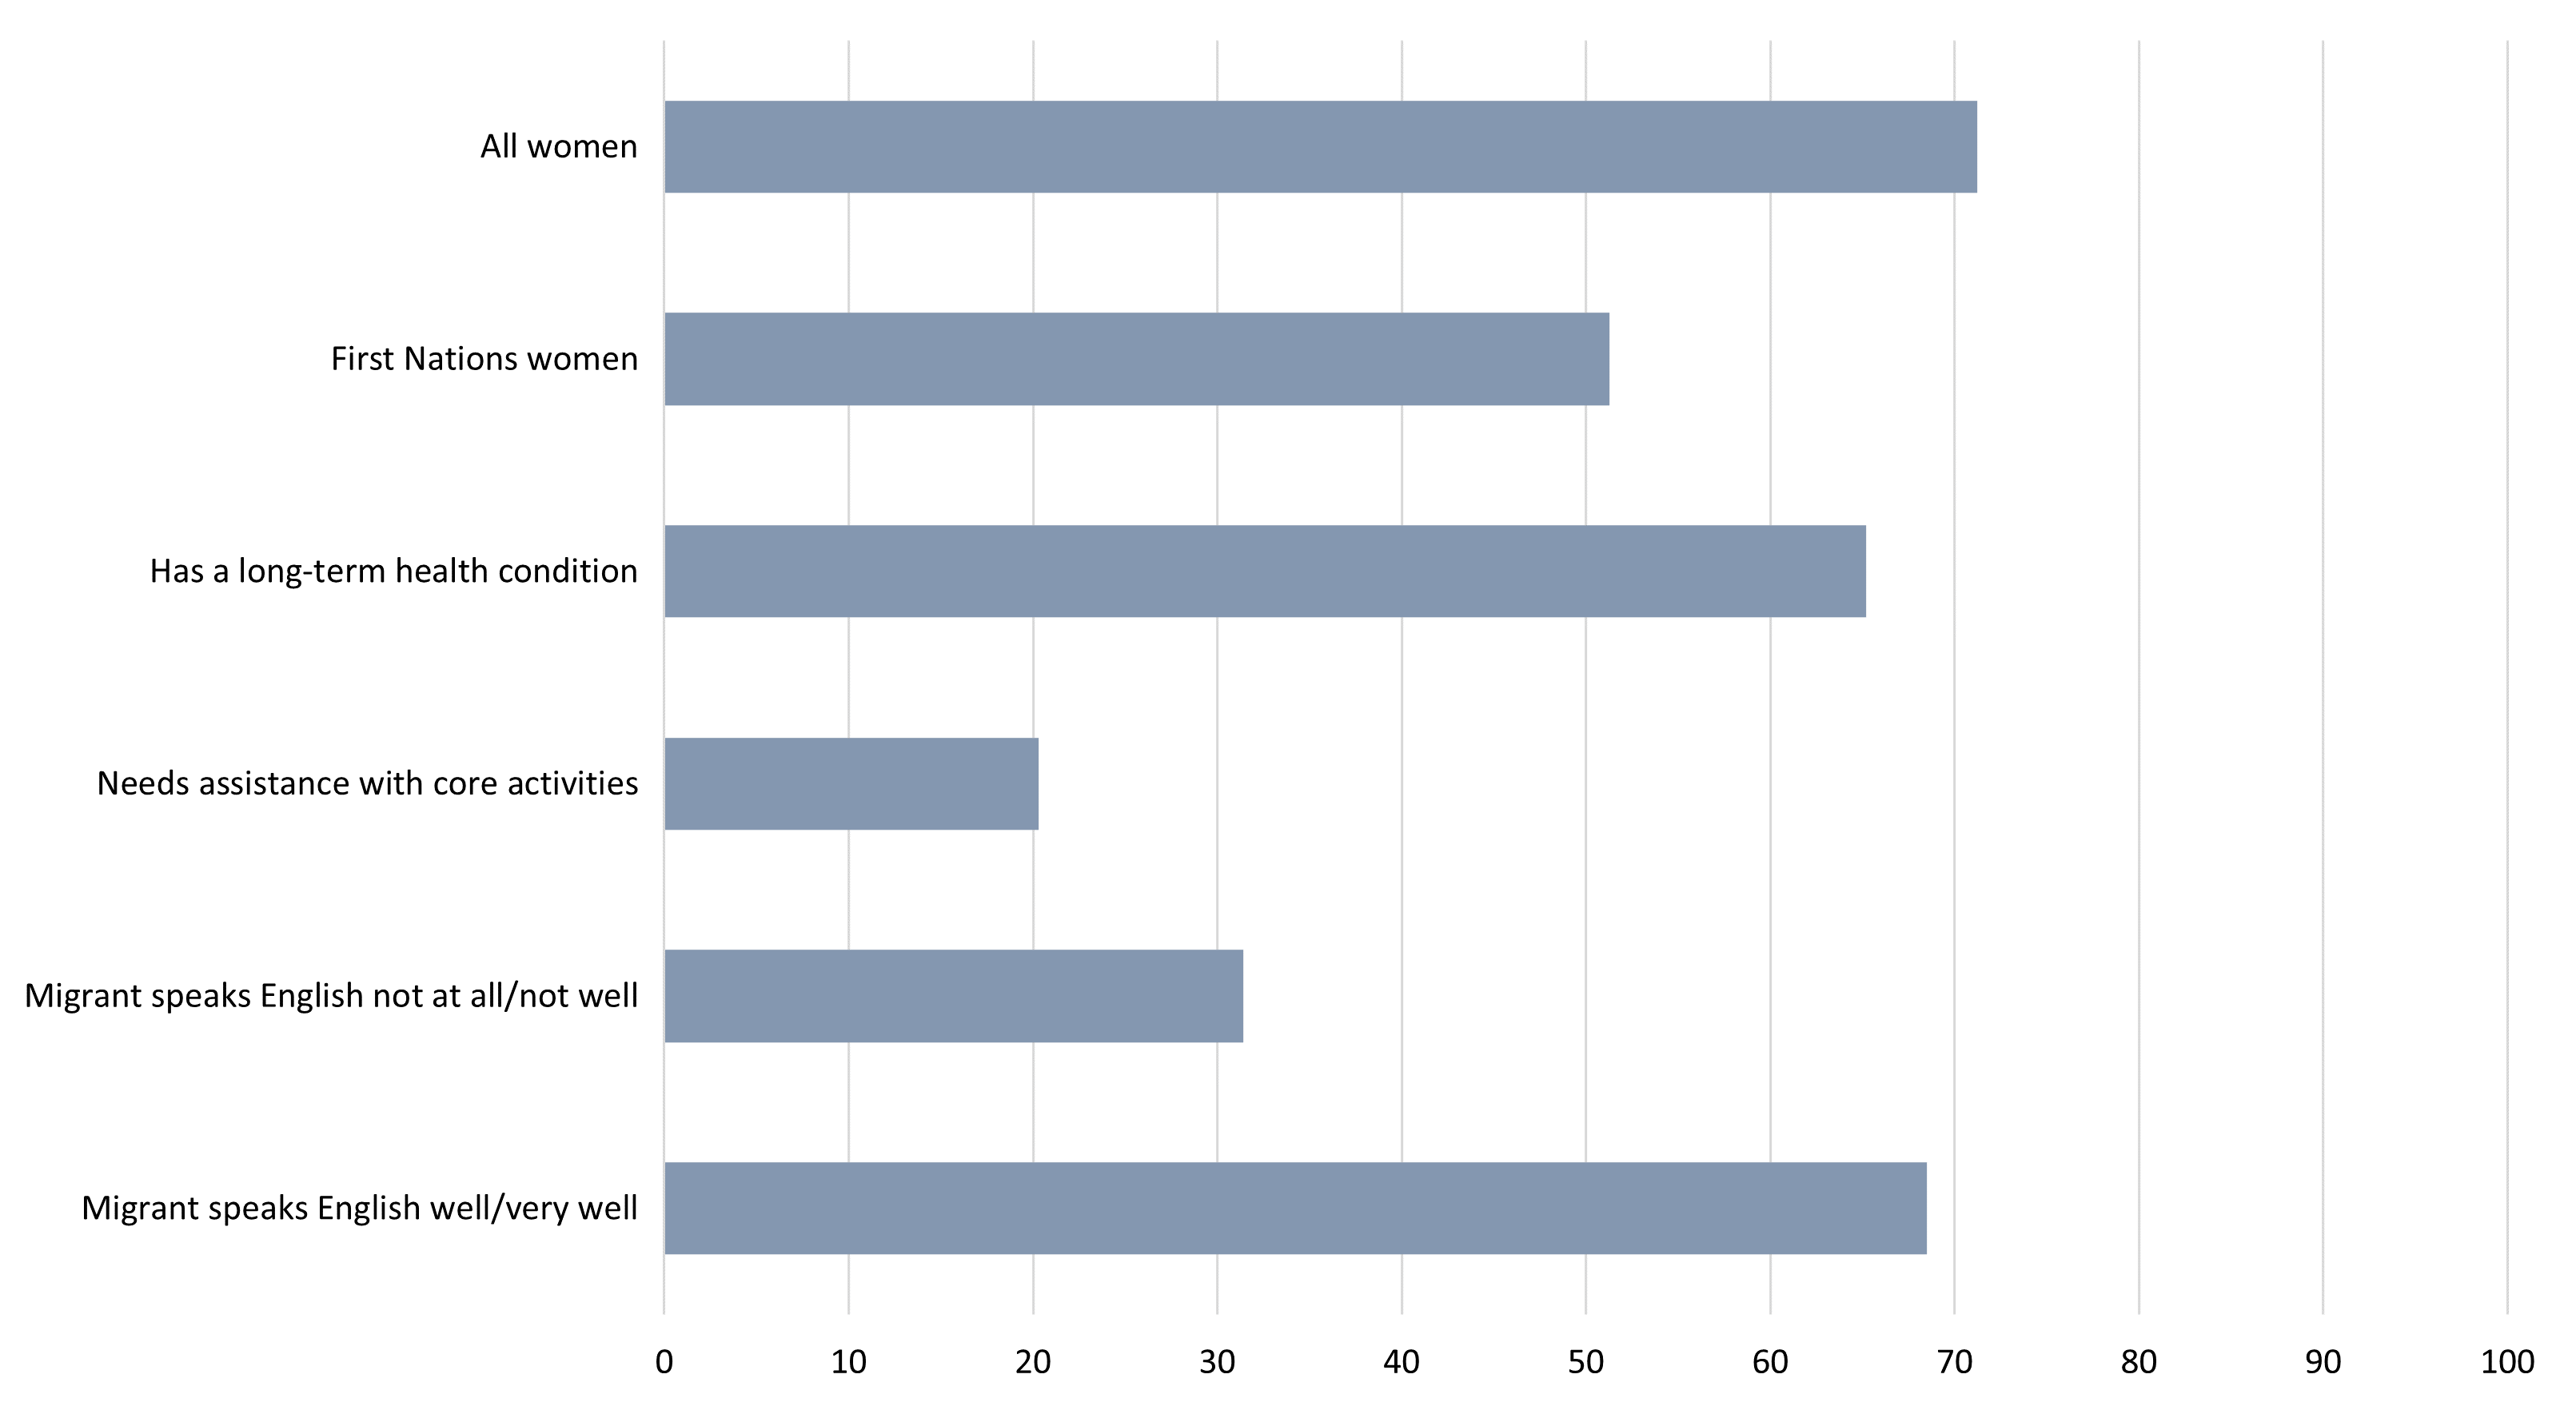
Source: Australian Bureau of Statistics (ABS), Census of Population and Housing, 2021, TableBuilder.
Indicating the many hurdles to employment, women who required assistance with core activities (such as self-care, mobility or communication) had the lowest employment rate, at about 20% in 2021. This figure is slightly lower than 2018 results for women with profound or severe disability. In 2021, women with a long-term health condition (for example, asthma, cancer, kidney disease, or a mental health condition) had an employment rate of 65% compared to the average of 71%. These measures provide a broad indication of women with disability, and are notably less comprehensive than other disability measures.
There are several ways in which cultural and linguistic diversity can be captured. Here, women who were born overseas and mainly spoke a language other than English at home are categorised by their perceived level of spoken English proficiency. These combined variables create a proxy measure for migrants. In 2021, migrant women who reported their spoken English as poor or non-existent had an employment rate of less than one-third of migrant women – 31% compared to 69%.
Since 1971, the Census has asked if someone identifies as being of Aboriginal or Torres Strait Islander origin. This question provides a measure of Indigenous status. In 2021, First Nations women living in capital city regions had higher employment rates (55%) than those who lived elsewhere (49%). To better reflect the younger age structure of First Nations women, broadening participation to include ‘studies’ shows about 57% were fully or partially engaged in education and/or employment in 2021.
Women in business
In 2021, about 10% of working women were employers or self-employed (in their main job), a similar level to forty years ago (about 11%). As with employment rates, there is variation in those women who own a business (see Chart 2). For example, in 2021, migrant women who identified their spoken English as poor or non-existent had much higher rates of business ownership than the average across all women. Migrant women were most likely to work in accommodation and food services; administrative and support services (includes for example, building cleaning services); or retail trade. In contrast, First Nations women were half as likely to be business owners or self-employed.
Chart 2 Proportion of female business owners (15 to 64 years) by selected characteristics, Australia, 2021
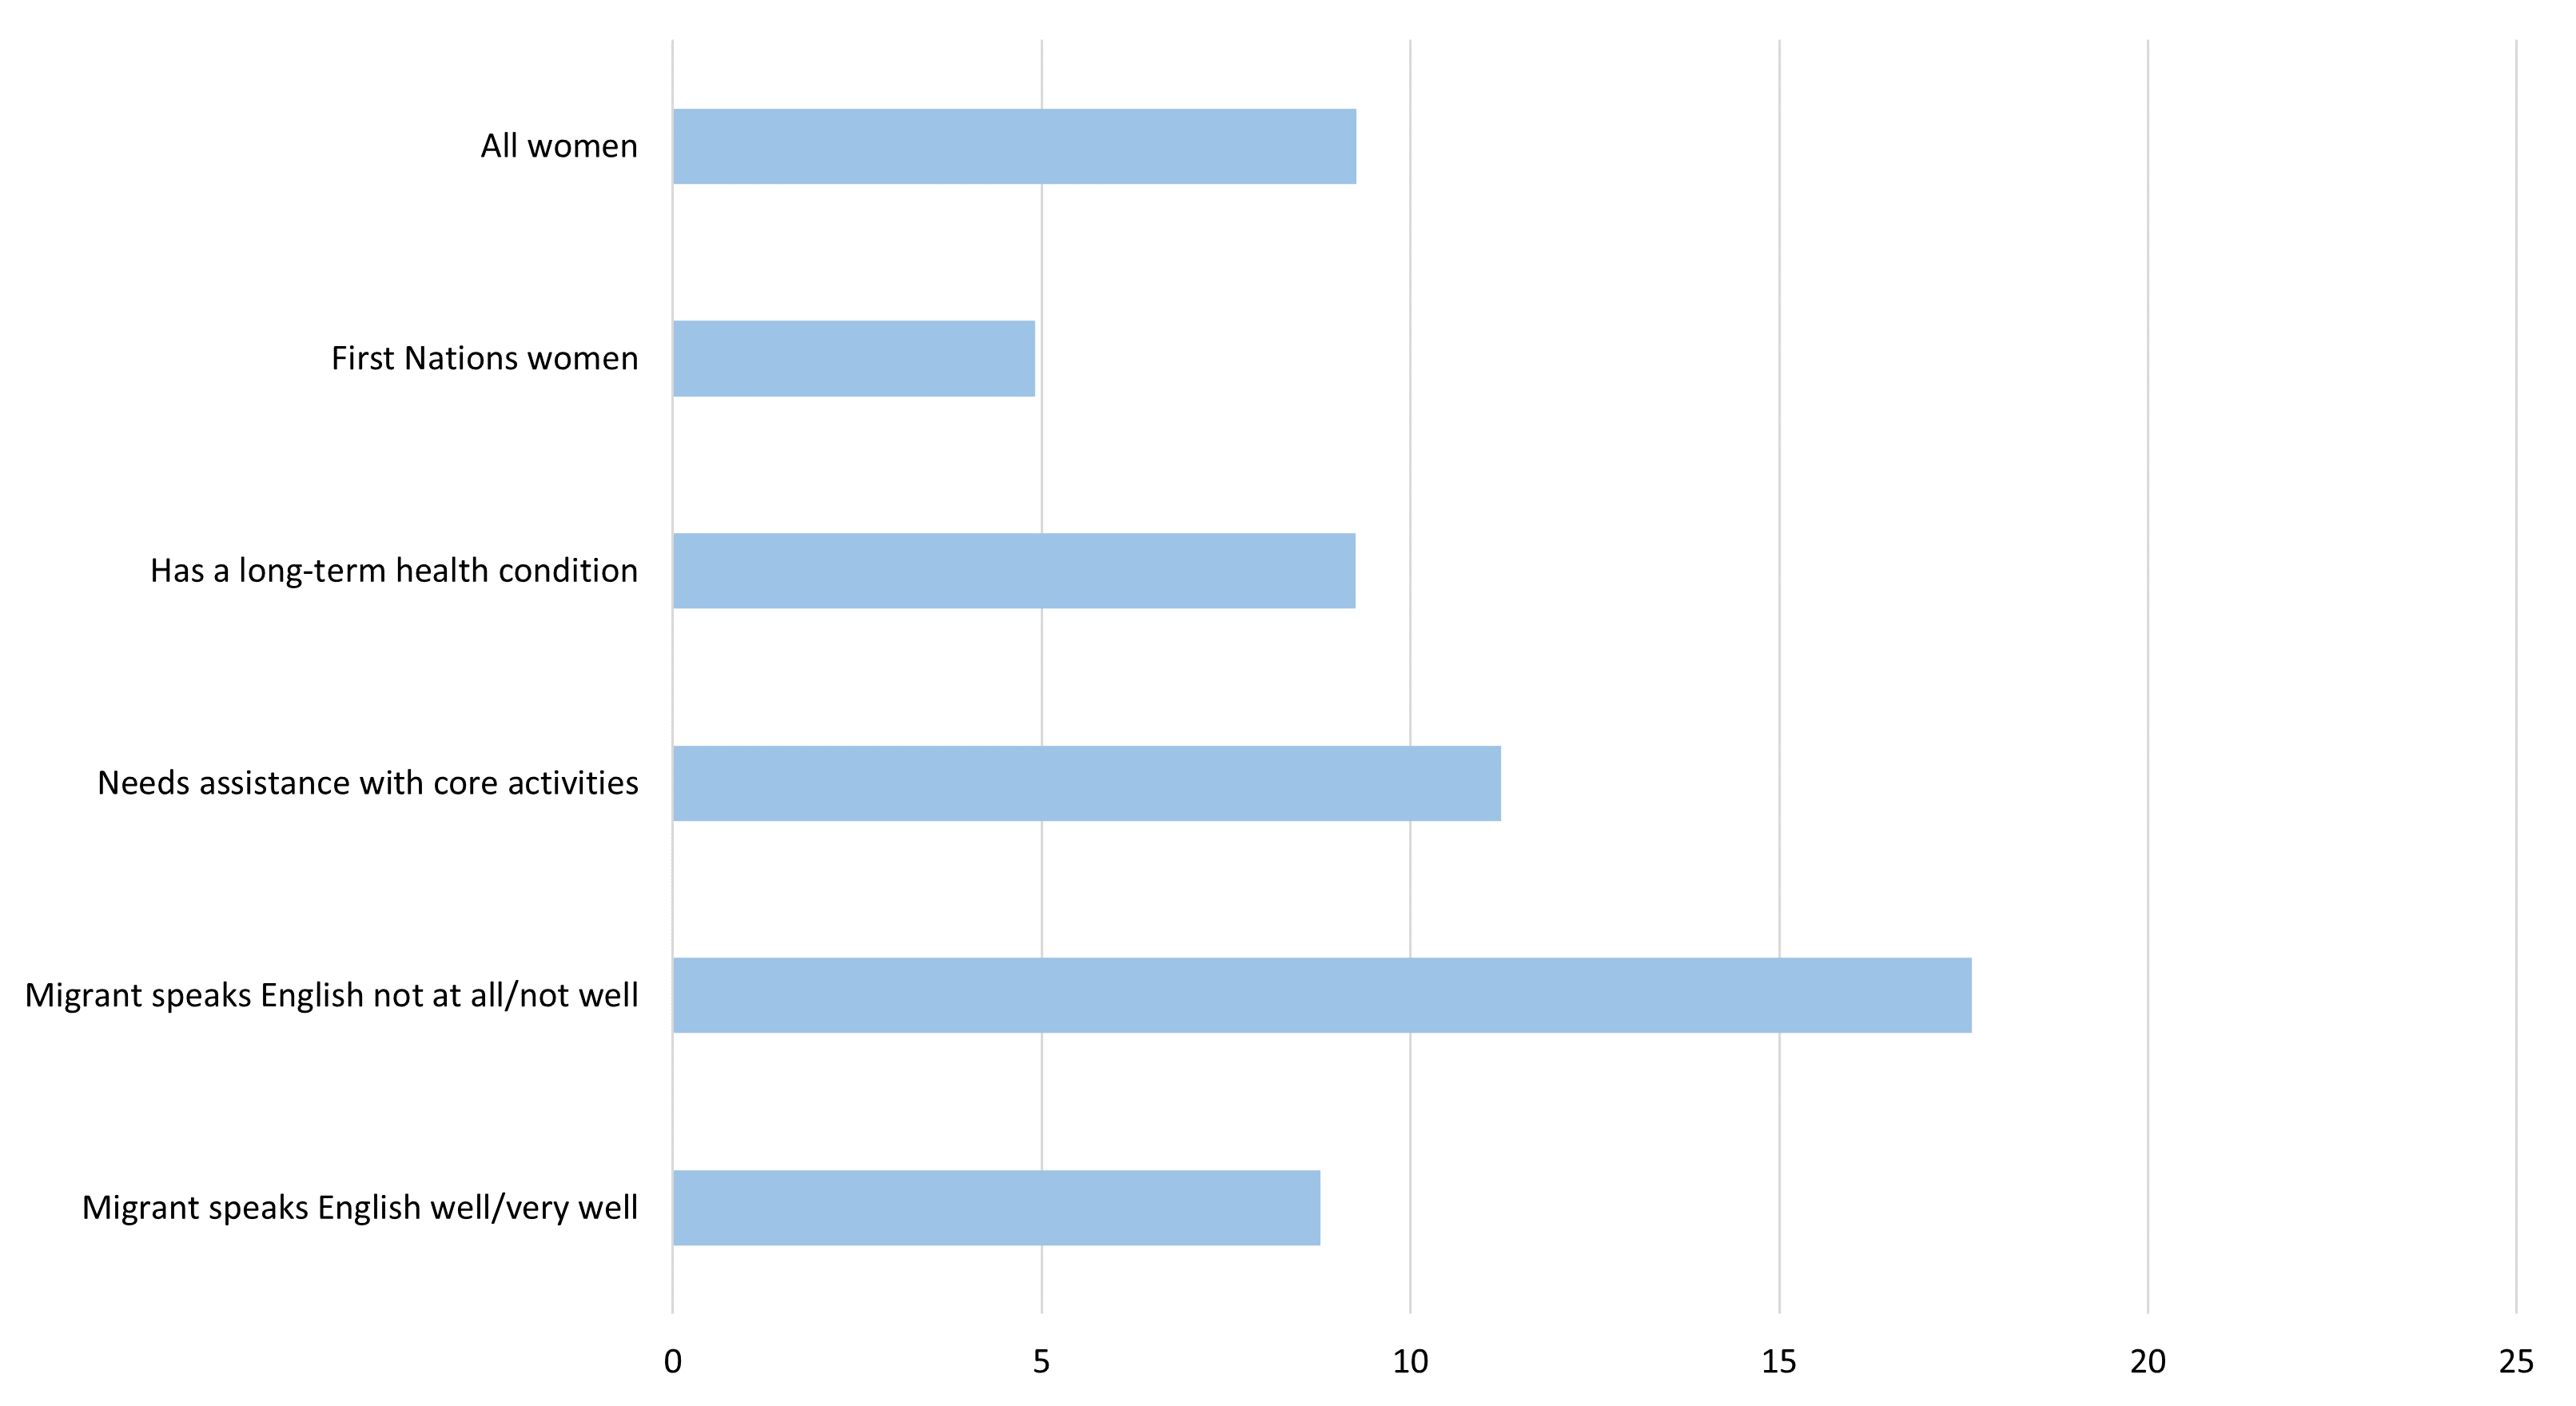
Source: ABS, Census of Population and Housing, 2021, TableBuilder.
Women in agriculture
Reflecting an overall decrease in the proportion of people employed in ‘agriculture, forestry and fishing’ (which includes hunting), women working in this industry decreased from about 5% in 1981 to less than 2% in 2021. Figure 1 portrays women’s agricultural employment by regions (Statistical Area Level 4, SA4s), shaded darkest red colour to lightest pale colour (highest to lowest proportion). The regions with the highest female employment in agriculture were: Darling Downs – Maranoa; Western Australia – Wheat Belt; Queensland – Outback; North West (Victoria); and South Australia – South West. A data file accompanies the image in the source details.
Figure 1 Proportion of women (15 to 64 years) employed in agriculture, forestry and fishing by regions (SA4), Australia, 2021
Source: ABS, Census of Population and Housing, 2021, TableBuilder; NationalMap, 2023; Parliamentary Library calculations [CSV file [11 KB]].
Women’s self-assessed health status
In 2020–21, employed women were more likely to report their general health as excellent or very good compared to unemployed women (see Chart 3). Furthermore, women who were neither in the workforce nor actively looking for work (‘not in the labour force’) were more than twice as likely to report fair or poor health compared to employed women.
Chart 3 Self-assessed health status of women (15 to 64 years) by labour force status, Australia, 2020–21
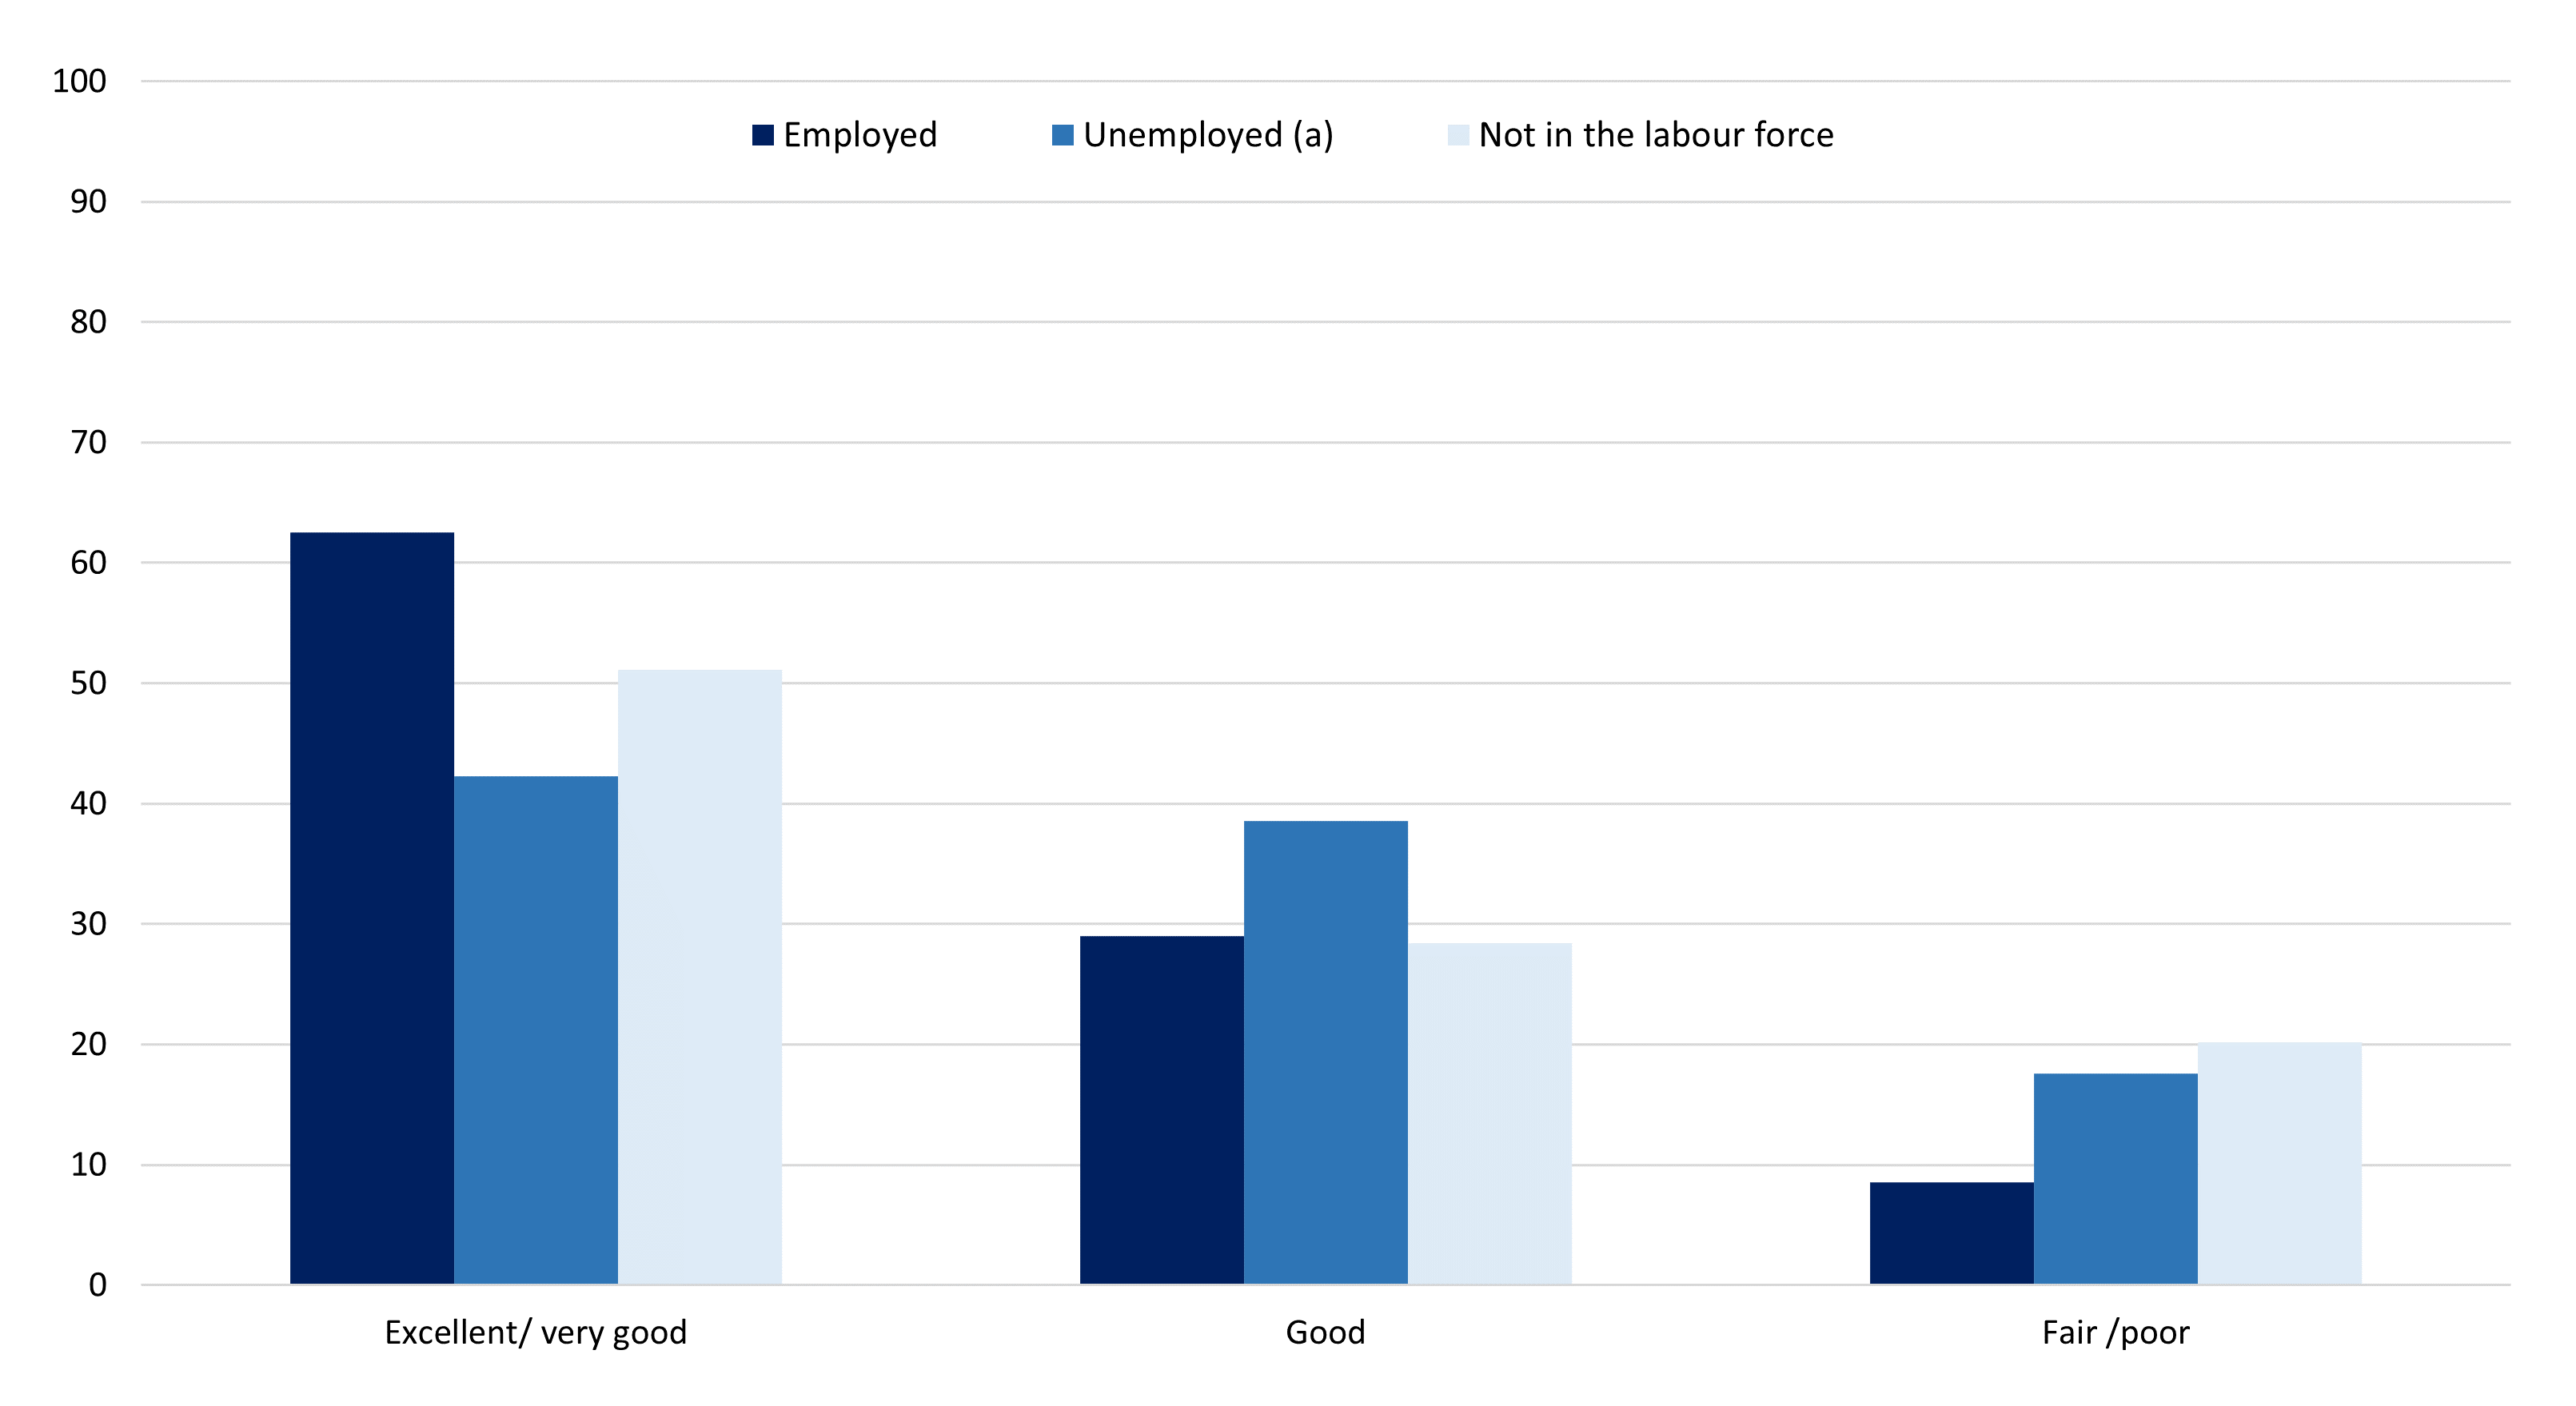
(a) The good and fair/poor status of unemployed people should be interpreted with caution due to volatility in the underlying data.
Source: ABS, National Health Survey, 2020–21, TableBuilder.
Women’s civic and community participation
In 2020, less than a third of women (15 to 69 years[2]) in Australia felt they were able to speak on important issues within their community all or most of the time, however this represents progress since 2014, increasing 5 percentage points. Relatedly, in the twelve months prior to 2020 only 7% of women were involved in a civic organisation or political group (such as a trade union association, political party, environmental or animal welfare group) — about half the 2014 result. These results should be interpreted with some caution as part of the 2020 survey reference period fell during COVID-19 lockdowns, and there was a high level of general uncertainty.
[1] The employment rate is employed women expressed as a proportion of total women (minus a small group whose labour force status was unknown). The employed are people who worked for pay or profit for one hour or more in the week before the Census.
[2] This age span varies to the earlier data, including a slightly larger group of women.