Workforce profile
At 30 June 2018, the department had 176 employees—129 ongoing, 14 non-ongoing and 33 casual.
The department’s workforce is 60 per cent female, 49 per cent under 45 years old and 1.7 per cent identifying as Aboriginal or Torres Strait Islander.
Employee classification and gender statistics
Table 9: Classification and gender at 30 June 2017
| |
Ongoing
|
Non-ongoing
|
Casual
|
Total
|
| |
Male
|
Female
|
Indeter-
minate/
intersex/
unspeci-
fied
|
Male
|
Female
|
Indeter-
minate/
intersex/
unspeci-
fied
|
Male
|
Female
|
Indeter-
minate/
intersex/
unspeci-
fied
|
Male
|
Female
|
Indeter-
minate/
intersex/
unspeci-
fied
|
Total
|
|
SES 3
|
1
|
–
|
–
|
–
|
–
|
–
|
–
|
–
|
–
|
1
|
–
|
–
|
1
|
|
SES 2
|
–
|
1
|
–
|
–
|
–
|
–
|
–
|
–
|
–
|
–
|
1
|
–
|
1
|
|
SES 1
|
3
|
1
|
–
|
–
|
–
|
–
|
–
|
–
|
–
|
3
|
1
|
–
|
4
|
|
EB 2
|
10
|
13
|
–
|
–
|
1
|
–
|
–
|
–
|
–
|
10
|
14
|
–
|
24
|
|
EB 1
|
24
|
15
|
–
|
–
|
3
|
–
|
–
|
–
|
–
|
24
|
18
|
–
|
42
|
|
PSL 6
|
7
|
16
|
–
|
1
|
–
|
–
|
–
|
–
|
–
|
8
|
16
|
–
|
24
|
|
PSL 5
|
1
|
6
|
–
|
–
|
1
|
–
|
–
|
–
|
–
|
1
|
7
|
–
|
8
|
|
PSL 4
|
3
|
17
|
–
|
1
|
5
|
–
|
1
|
1
|
–
|
5
|
23
|
–
|
28
|
|
PSL 3
|
2
|
2
|
–
|
–
|
2
|
–
|
1
|
1
|
–
|
3
|
5
|
–
|
8
|
|
PSL 2
|
2
|
1
|
–
|
–
|
1
|
–
|
16
|
14
|
–
|
18
|
16
|
–
|
34
|
|
PSL 1
|
–
|
–
|
–
|
–
|
–
|
–
|
–
|
–
|
–
|
–
|
–
|
–
|
–
|
|
Total
|
53
|
72
|
–
|
2
|
13
|
–
|
18
|
16
|
–
|
73
|
101
|
–
|
174
|
Table 10: Classification and gender at 30 June 2018
| |
Ongoing
|
Non-ongoing
|
Casual
|
Total
|
| |
Male
|
Female
|
Indeter-
minate/
intersex/
unspeci-
fied
|
Male
|
Female
|
Indeter-
minate/
intersex/
unspeci-
fied
|
Male
|
Female
|
Indeter-
minate/
intersex/
unspeci-
fied
|
Male
|
Female
|
Indeter-
minate/
intersex/
unspeci-
fied
|
Total
|
|
SES 3
|
1
|
–
|
–
|
–
|
–
|
–
|
–
|
–
|
–
|
1
|
–
|
–
|
1
|
|
SES 2
|
–
|
1
|
–
|
–
|
–
|
–
|
–
|
–
|
–
|
–
|
1
|
–
|
1
|
|
SES 1
|
2
|
2
|
–
|
–
|
–
|
–
|
–
|
–
|
–
|
2
|
2
|
–
|
4
|
|
EB 2
|
9
|
11
|
–
|
–
|
1
|
–
|
–
|
–
|
–
|
9
|
12
|
–
|
21
|
|
EB 1
|
24
|
21
|
–
|
–
|
2
|
–
|
–
|
–
|
–
|
24
|
23
|
–
|
47
|
|
PSL 6
|
8
|
16
|
–
|
1
|
1
|
–
|
–
|
–
|
–
|
9
|
17
|
–
|
26
|
|
PSL 5
|
1
|
3
|
–
|
–
|
1
|
–
|
–
|
–
|
–
|
1
|
4
|
–
|
5
|
|
PSL 4
|
3
|
20
|
–
|
2
|
5
|
–
|
–
|
1
|
–
|
5
|
26
|
–
|
31
|
|
PSL 3
|
2
|
2
|
–
|
–
|
–
|
–
|
1
|
–
|
–
|
3
|
2
|
–
|
5
|
|
PSL 2
|
2
|
1
|
–
|
–
|
1
|
–
|
17
|
14
|
–
|
19
|
16
|
–
|
35
|
|
PSL 1
|
–
|
–
|
–
|
–
|
–
|
–
|
–
|
–
|
–
|
–
|
–
|
–
|
–
|
|
Total
|
52
|
77
|
–
|
3
|
11
|
–
|
18
|
15
|
–
|
73
|
103
|
–
|
176
|
Table 11: Employment type by full-time and part-time status, 2016–17 and 2017–18
| |
at 30 June 2017
|
at 30 June 2018
|
| |
Ongoing
|
Non-ongoing
|
|
Ongoing
|
Non-ongoing
|
|
| |
Full-time
|
Part-time
|
Full-time
|
Part-time
|
Total
|
Full-time
|
Part-time
|
Full-time
|
Part-time
|
Total
|
|
SES 3
|
1
|
–
|
–
|
–
|
1
|
1
|
–
|
–
|
–
|
1
|
|
SES 2
|
1
|
–
|
–
|
–
|
1
|
1
|
–
|
–
|
–
|
1
|
|
SES 1
|
4
|
–
|
–
|
–
|
4
|
4
|
–
|
–
|
–
|
4
|
|
EB 2
|
23
|
–
|
1
|
–
|
24
|
20
|
–
|
1
|
–
|
21
|
|
EB 1
|
38
|
1
|
2
|
1
|
42
|
40
|
5
|
2
|
–
|
47
|
|
PSL 6
|
21
|
2
|
1
|
–
|
24
|
20
|
4
|
–
|
2
|
26
|
|
PSL 5
|
7
|
–
|
1
|
–
|
8
|
4
|
–
|
1
|
–
|
5
|
|
PSL 4
|
18
|
2
|
4
|
4
|
28
|
21
|
2
|
8
|
–
|
31
|
|
PSL 3
|
4
|
–
|
2
|
2
|
8
|
4
|
–
|
1
|
–
|
5
|
|
PSL 2
|
3
|
–
|
1
|
30
|
34
|
3
|
–
|
32
|
–
|
35
|
|
PSL 1
|
–
|
–
|
–
|
–
|
–
|
–
|
–
|
–
|
–
|
–
|
|
Total
|
120
|
5
|
12
|
37
|
174
|
118
|
11
|
45
|
2
|
176
|
Table 12: Employment type by location
| |
at 30 June 2017
|
at 30 June 2018
|
| |
Ongoing
|
Non-ongoing
|
Casual
|
Total
|
Ongoing
|
Non-ongoing
|
Casual
|
Total
|
|
Office
|
|
Executive
|
9
|
–
|
–
|
9
|
8
|
1
|
–
|
9
|
|
Executive support/project staff
|
5
|
–
|
–
|
5
|
4
|
–
|
–
|
4
|
|
Table Office
|
12
|
–
|
1
|
13
|
10
|
–
|
1
|
11
|
|
Chamber Research Office
|
7
|
1
|
–
|
8
|
8
|
–
|
–
|
8
|
|
International and Parliamentary Relations Office
|
6
|
–
|
–
|
6
|
8
|
1
|
–
|
9
|
|
Committee Office
|
53
|
7
|
–
|
60
|
58
|
7
|
–
|
65
|
|
Serjeant-at-Arms’ Office
|
9
|
3
|
31
|
43
|
10
|
2
|
31
|
43
|
|
People Strategies Office
|
6
|
3
|
1
|
10
|
7
|
1
|
–
|
8
|
|
Parliamentary and Business Information
Services Office
|
10
|
1
|
1
|
12
|
10
|
2
|
1
|
13
|
|
Finance Office
|
6
|
–
|
–
|
6
|
5
|
–
|
–
|
5
|
|
Parliamentary Skills Centre
|
2
|
–
|
–
|
2
|
1
|
–
|
–
|
1
|
|
State
|
|
ACT
|
125
|
15
|
34
|
174
|
129
|
14
|
33
|
176
|
Table 13: Indigenous employee staffing
| |
at 30 June 2017
|
at 30 June 2018
|
|
Ongoing
|
–
|
–
|
|
Non-ongoing
|
4
|
3
|
|
Casual
|
–
|
–
|
|
Total
|
4
|
3
|
Employee engagement
Investors in People standard
The Investors in People standard is an internationally recognised mark of good practice that focuses on how well an employer creates an environment to lead, support and develop its people. The department has held accreditation against the Investors in People standard since 2002, and was awarded ‘Investors in People Silver’ in 2015. Since the last assessment in 2015 Investors in People has introduced an improved framework. The new framework’s performance model provides a clear pathway to map the strategies of continuous improvement and high-performance working practices.
The Investors in People standard provides a structure for high performance to help every person be the best they can be. The achievement of the standard recognises the strong commitment of departmental employees to ensure the highest possible standards of service. One of the requirements for retaining accreditation is to be reassessed against the standard every three years by an independent assessor. The next accreditation process has commenced.
Staff survey
In May 2018, the department conducted its annual staff survey to measure employee engagement, quality of leadership and views about the broader working environment.
The results of the survey are used to inform improvement initiatives and to develop solutions to optimise the culture of the department. Ideas and feedback from employees are critical to enable sustainable change across the department and to sustain a high-performance culture.
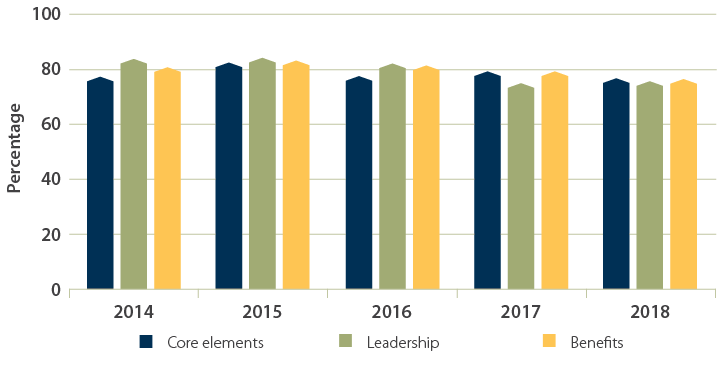
The department has established three internal benchmarks based on the results of the survey. These benchmarks, or index scores, correspond to the total percentage of staff selecting ‘strongly agreed’ and ‘agreed’ in response to specific sets of questions. The three benchmarks are as follows:
- The ‘core elements’ satisfaction index measures the extent to which the department provided the core elements needed to attract, focus and keep the most talented staff (satisfaction rate of 80.4 per cent in 2018 and an average of 82.2 per cent over the past five years).
- The ‘leadership’ satisfaction index measures the level of satisfaction of staff with their managers against the department’s leadership statement (satisfaction rate of 79.3 per cent in 2018 and an average of 83.8 per cent over the past five years).
- The ‘benefits’ satisfaction index measures the level of staff satisfaction with pay and working conditions (satisfaction rate of 80.1 per cent in 2018 and an average of 84 per cent over the past five years).
Figure 7 shows the performance of the satisfaction elements in the past five years. A satisfaction rating of 80 per cent or above is considered high.
Figure 7 Staff survey satisfaction elements, 2014–18
People strategies: planning and delivery
Recruitment
The department advertised to fill 30 ongoing vacancies during 2017–18 (compared with 23 in 2016–17), of which 16 were filled by external applicants.
Retention
Twelve ongoing and 18 non-ongoing staff left the department in 2017–18. The turnover rate was 7.8 per cent for ongoing staff (compared with 8.5 per cent in 2016–17).
Exit interviews with staff leaving the department continued to be conducted by Senior Executive Service (SES) managers. Nine such interviews were conducted during the year.
Alumni
The department formed an alumni association of former staff in 2008. On 30 June 2018, it had 220 members. The association issued two newsletters during the year, and its board met once. On 14 November 2017, the association held its annual general meeting and two co-chairs were elected.
Graduate program
The department administers the Parliament of Australia Graduate Program, in conjunction with the Department of the Senate, DPS and the Parliamentary Budget Office. The purpose of the program is to expose graduates working in Australian public service departments and agencies to how their home department or agency interacts with the parliamentary departments in their support of the parliament.
The program assists graduates to develop the necessary knowledge and skills to make a significant contribution to the department and broader parliamentary service. It continued to draw a high level of interest from graduates from a range of agencies. Eight graduates undertook placements in the department in 2017–18.
Positive feedback was received from the graduates, indicating they had all had valuable experiences with the department and will take their learnings back to their home agency.
Learning and development
In 2017–18 the department delivered 109 face-to-face training and development sessions to employees, based around the core themes of critical thinking, writing skills, management capability and fostering high performance. Priority skills training focused on leadership development, and the department has engaged a range of external providers to deliver specialised training to staff.
Table 14 compares the attendance of staff at training courses in 2016–17 and 2017–18. It also shows the average staffing level and total number of training days attended in 2017–18 for each classification.
Table 14: Staff attendance at training courses
|
Classification
|
Headcount
|
Training days attended
|
Average training days attended
|
| |
2017–18
|
2017–18
|
2016–17
|
2017–18
|
|
Senior Executive Service
|
6
|
22
|
4.7
|
3.7
|
|
Executive Band 2
|
21
|
125
|
2.2
|
5.9
|
|
Executive Band 1
|
47
|
246
|
2.2
|
5.2
|
|
Parliamentary Service Level 6
|
26
|
95
|
1.6
|
3.7
|
|
Parliamentary Service Level 5
|
5
|
19
|
2.1
|
3.8
|
|
Parliamentary Service Level 4
|
31
|
178
|
3.1
|
5.7
|
|
Parliamentary Service Level 3
|
5
|
14
|
2.9
|
2.8
|
|
Parliamentary Service Level 2
|
35
|
42
|
1.8
|
1.2
|
|
Not specified
|
–
|
99
|
–
|
–
|
|
Total
|
176
|
840
|
3.1
|
4.8
|
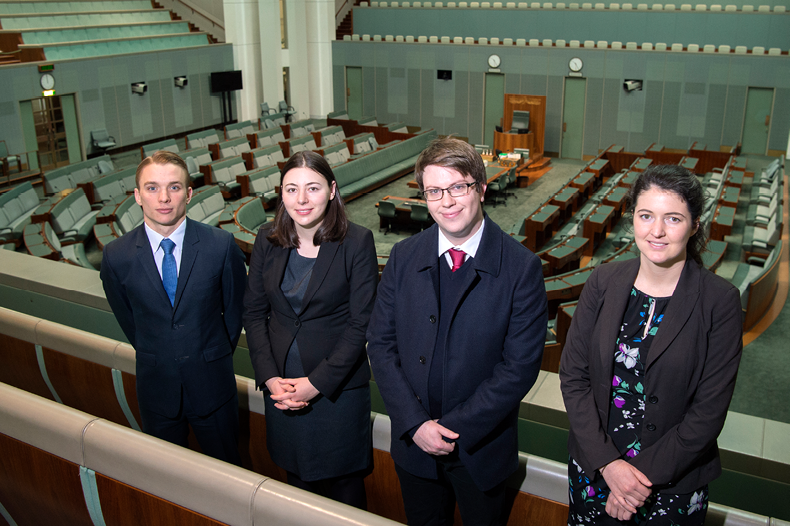
2017–18 Graduate Program participants James Mohun, Erin Corkill, Alex Rae and Sarah Grant. Image: Penny Bradfield, Auspic/DPS.
Studies assistance
The department’s study assistance scheme allows employees to complete relevant tertiary study to improve their professional skills and knowledge. Seven employees accessed studies assistance during the year (compared with seven in 2016–17). Collectively, financial assistance of $22,595 was administered (compared with $29,115 in 2016–17), along with a total of 36.67 days of study leave on full pay.
Performance assessment
All eligible staff participated in the annual work performance assessment cycle, which was completed on 31 October 2017. The cycle consists of setting individual work objectives, conducting performance assessments, preparing individual development plans and providing feedback to supervisors. Information from the individual development plans is used to formulate the training program for the next calendar year.
Diversity and inclusion
The department is committed to actively building a diverse and inclusive workplace that promotes gender equality and harnesses the skills and experiences of people from all backgrounds. The department’s diversity and inclusion program has a significant focus on increasing workforce participation rates across all diversity groups.
The department supported the commitments outlined in the Australian Parliament’s Reconciliation action plan 2016–18.
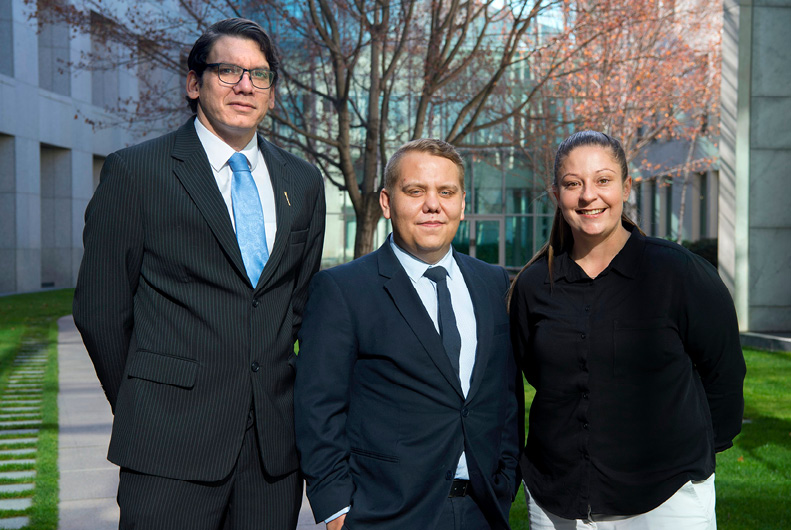
2017–18 Indigenous secondees Ben Vea Vea, Michael Ohrin and Elizabeth Olive. Image: Penny Bradfield, Auspic/DPS.
In 2016–17, the department developed an Indigenous Secondment Program. This program provides opportunities for graduates from the Indigenous Australian Government Development Program to participate in three-month placements with the department. It is a significant part of the department’s commitment to provide opportunities for the career progression and professional development of Aboriginal and Torres Strait Islander people. At the completion of the program, participants return to their home departments with valuable experiences of parliamentary operations.
The Indigenous Secondment Program attracted a high level of interest from Aboriginal and Torres Strait Islander people from a range of Commonwealth agencies, and three placements were undertaken in 2017–18.
Employment arrangements
In December 2017, employees voted in a new enterprise agreement. A total of 85 per cent of eligible employees participated in the vote, of whom 82 per cent voted ‘yes’ to the agreement. The Department of the House of Representatives Enterprise Agreement 2017–20 covers all employees except SES employees, who are covered by determinations made under section 24(1) of the Parliamentary Service Act 1999.
There is no provision in the enterprise agreement to remunerate staff based on performance. The Clerk did not make a determination under section 24(1) of the Act in 2017–18 to pay staff a monetary bonus.
Salary scales under the 2017–20 agreement are summarised in Table 15.
Table 15: Salary scales of staff covered by the 2017–20 enterprise agreement
|
Classification
|
Salary scale ($)
|
|
Executive Band 2
|
136,586–144,724
|
|
Executive Band 1
|
105,531–117,711
|
|
Parliamentary Service Level 6
|
85,047–96,520
|
|
Parliamentary Service Level 5
|
78,610–83,181
|
|
Parliamentary Service Level 4
|
69,498–75,191
|
|
Parliamentary Service Level 3
|
62,875–67,543
|
|
Parliamentary Service Level 2
|
55,877–61,012
|
|
Parliamentary Service Level 1
|
49,394–54,047
|
Salaries expenditure
In 2017–18, departmental salaries and allowances totalled $19.410 million (compared with $18.762 million in 2016–17).
Work health and safety
The department maintains a strong commitment to the health and wellbeing of all employees and visitors. During the reporting period, all reasonably practicable measures were taken to protect the health, safety and welfare of employees while at work, in line with the department’s work health and safety policies. The department is committed to fulfilling its responsibilities under the Work Health and Safety Act 2011 (WHS Act), the Work Health and Safety Regulations 2011 and the Safety, Rehabilitation and Compensation Act 1988.
In 2017–18, the department continued to apply an evidence-based risk management approach, after implementing the work health and safety management system in the previous year. The department aims to deliver high-quality and timely outcomes, providing leadership, direction, capability and governance, to nurture a safety culture. Through the Rehabilitation Management System the department enhances positive early intervention outcomes that have supported injured or ill workers to achieve an early, safe and sustainable return to work. There has been a strong focus in providing and fostering a flexible workplace to take account of employees’ health and wellbeing.
The department’s Comcare premium rate for 2017–18 was 0.27 per cent of payroll, a decrease from 2016–17 of 0.43 per cent.
No workers compensation claims were lodged during the reporting period.
During the year, there were no dangerous occurrences requiring notification under section 37 of the WHS Act, no investigations were carried out, and no directions or notices were received by the department under section 191 of the Act.