Figure 1: Underlying cash balance2 Per cent of GDP
Figure 2: Total payments and receipts2 Per cent of GDP
Figure 3: Net debt2 Per cent of GDP
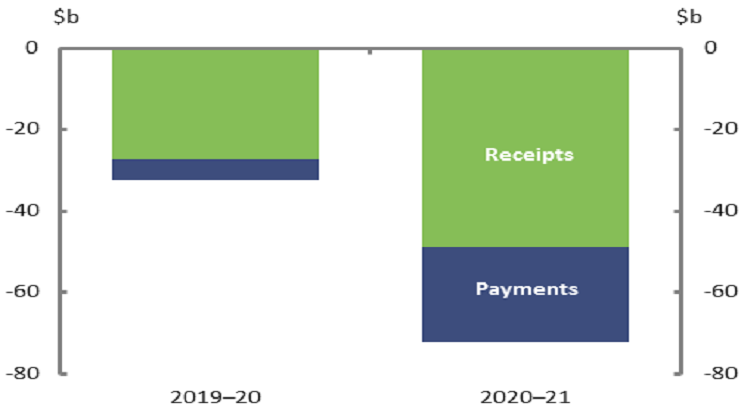
Figure 4: Underlying cash balance
Figure 5: Decomposition of deterioration in the underlying cash balance3,4
Figure 6: Key economic parameters5
Figure 7: Impact of policy decisions on the underlying cash balance6
Figure 8: Top receipts measures7 Total, 2019–20 to 2023–24
Figure 9: Top payments measures7 Total 2019–20 to 2023–24
Figure 10: Impact of parameter and other variations on the underlying cash balance4,8
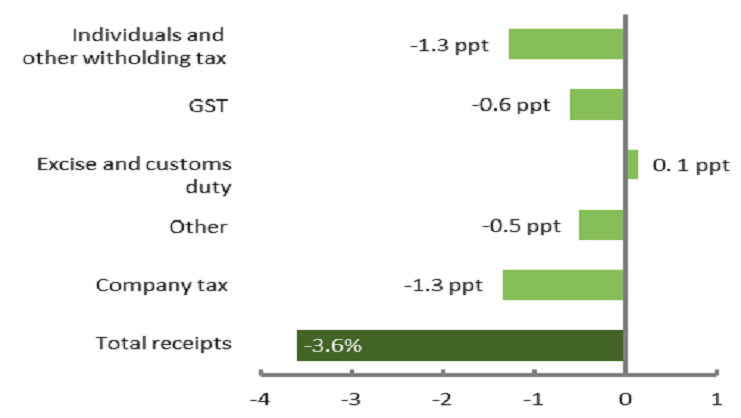
Figure 11: Contributions to annual real growth in receipts9, 10,11 Average, 2018–19 to 2020–21
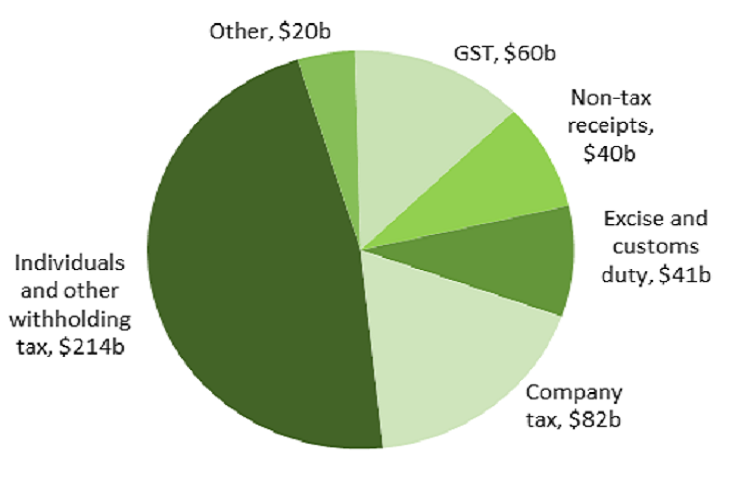
Figure 12: Receipts in 2020-21, $456b10
Senate
House of Representatives
Get informed
Bills
Committees
Get involved
Visit Parliament