Figure 1: Underlying cash balance2 Per cent of GDP
Figure 2: Underlying cash balance
Figure 3: Decomposition of change in underlying cash balance3
Figure 4: Total payments and receipts24 Per cent of GDP
Figure 5: Net debt and net interest payments2 Per cent of GDP
Figure 6: Components of net financial worth25
Figure 7: Key economic parameters: last four updates Per cent growth6
Figure 8: Composition of revenue in 2020-21, $486b7,8
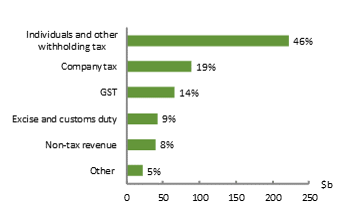
Figure 9: Contributions to annual real growth in revenue8,9 Average, 2020-21 to 2023-24
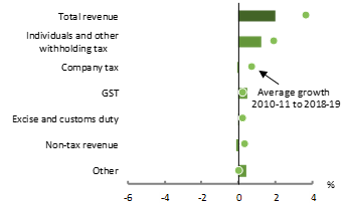
Figure 10: Revisions to receipts forecasts since 2020-21 Budget8
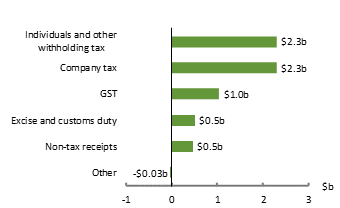
Figure 11: Composition of expenses in 2020-21, $667b7,10
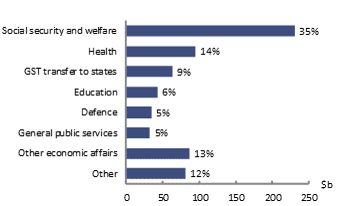
Figure 12: Contributions to annual real growth in expenses10,11,12 Average, 2020-21 to 2023-24
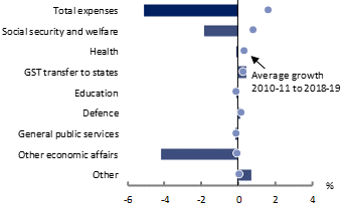
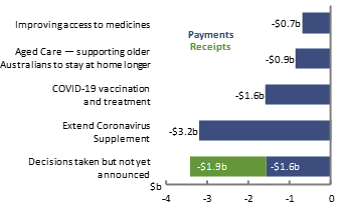
Figure 13: Largest measures13,14 Total, 2020-21 to 2023-24
Senate
House of Representatives
Get informed
Bills
Committees
Get involved
Visit Parliament