Posted 30/07/2014 by Tarek Dale
Discussions of the distribution of revenue from the Goods and Services Tax (GST) to the Australian States and Territories often refer to the GST that a particular state ‘collects’, or GST raised in a particular state. These are actually references to ‘relativities’, a term which describes the portion of GST a state gets relative to an equal per-capita distribution. This flagpost outlines how the location of GST collection differs from the per-capita approach and ‘relativities’ that underlie the actual distribution of GST revenue.
GST revenue is collected by the Commonwealth, and then distributed to the State and Territory governments (‘the states’). The current GST distribution framework is not based on where transactions physically take place, or in which state GST revenue is raised. In fact, it could prove complicated to try and allocate particular transactions to one location – sales that are liable to GST made across a state border would need to be allocated to one state or another. As the Commonwealth Grants Commission (CGC) notes in its 2014 annual update (p. 36):
Some people have misinterpreted a relativity to be the proportion of the GST revenue raised in a State which is returned to that State. This would only be true if the GST collected per person were the same in every State, which given differences among the States appears unlikely.
The starting point for the CGC (the body which provides advice on the distribution of GST) is the population distribution. Specifically, the CGC estimates the share of GST revenue that the states would receive if GST was distributed according to each state’s population (an equal, per-capita distribution).
The CGC also uses a complex assessment to calculate a ‘relativity’ for each state. As described in the Budget papers:
The relativities determine how much GST each State receives compared with an equal per capita share and are determined such that, if each State made the same effort to raise revenue from its own sources and operated at the same level of efficiency, each State would have the capacity to provide services and the associated infrastructure at the same standard.
The CGC has written extensively on how it calculates relativities (their frequently asked questions provide a high level summary, and their annual updates include extensive detail). A 2012 review of GST distribution also examined the process in detail.
Multiplying a state’s equal per-capita share of GST revenue by its relativity gives the actual share of GST it receives (there are some minor adjustments when the GST revenue is more or less than expected). A relativity greater than one means the state gets more than it would on an equal per-capita basis; a relativity less than one means it gets less revenue than on an equal per-capita basis. In the table below, a state’s actual share (C) is calculated by multiplying its equal per-capita share (A) and its relativity (B).
| State or Territory |
Share if GST were distributed on an equal per-capita basis (A) |
2014–15 relativity (B) |
2014–15 actual GST share after adjusting by the relativity (C) |
| NSW |
32.00% |
0.975 |
31.20% |
| VIC |
24.92% |
0.88282 |
22.00% |
| QLD |
20.30% |
1.07876 |
21.90% |
| WA |
11.16% |
0.37627 |
4.20% |
| SA |
7.14% |
1.28803 |
9.20% |
| TAS |
2.20% |
1.63485 |
3.60% |
| ACT |
1.62% |
1.23600 |
2.00% |
| NT |
1.04% |
5.66061 |
5.90% |
Source: Parliamentary Lbrary estimates based on Australian Government, Federal financial relations: budget paper no. 3 2014–15, Table 3.7.
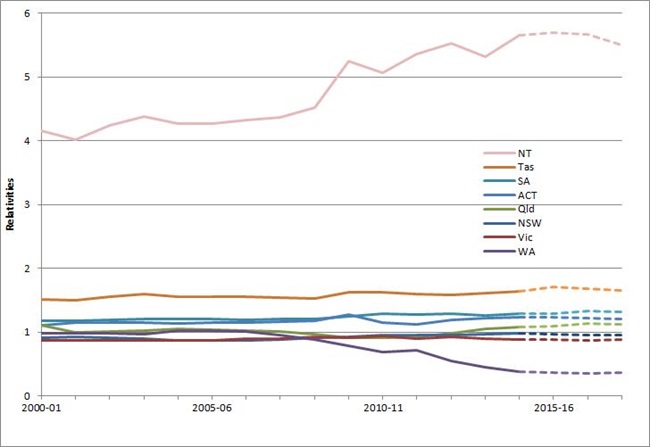
The chart below shows historical relativities, and the projected relativities in the 2014-15 Budget. For most states, relativities have generally been unchanged since the introduction of the GST. However, some states, particularly Western Australia and the Northern Territory have experienced significant changes in the relativities.
In its most recent update, the CGC stated (p. XX):
Western Australia’s above average revenue raising capacity drives its fiscal strength … The relatively low fiscal capacities of South Australia, Tasmania and the ACT stem mostly from below average capacities to raise revenue while Queensland and the Northern Territory face very high costs of providing services.

Sources: Commonwealth Grants Commission, Report on 2014 Revenue Sharing Relativities, Table E-1, p. 135. Treasury projections for 2015–16 onwards are from the 2014–15 Budget, Budget Paper No. 3, Table 3.2.
Authored by Tarek Dale and Alicia Hall, with assistance from Daniel Weight.
Economics Section and Statistics and Mapping Section, Parliamentary Library