Key issues
- The Australian welfare state is facing significant demographic,
economic and political challenges, which are likely to require a
reconsideration of the structure and funding of Australian welfare programs
to ensure they are meeting their objectives.
- Growing expenditure on universal programs has seen calls for
increased targeting of funding, but governments are also looking to expand
access to support to assist families with cost pressures.
Introduction
The Australian welfare state is facing significant
demographic, economic and political challenges. An ageing population will require
more support from health and aged care services. The need for disability
supports and the cost of services delivered through the National Disability
Insurance Scheme (NDIS) has exceeded
initial projections (pp. 152–153). The Intergenerational
report 2023 found that structural changes in the economy will
narrow the tax base used to fund these services (p. xv). Spending reductions on
social security payments will not offset increases in other areas of social
spending (p. 147). Many developed countries face similar pressures.
These challenges mean that key features of Australia’s
welfare state could be reconsidered – particularly the way that services and
supports are targeted. Growing expenditure on universal systems such as the
NDIS has resulted in calls
for increased targeting, particularly through means testing. However, increasing
the extent of means testing in the Australian welfare state is likely to raise
further complications. Cost of living issues could even see calls for an
expansion in access to government support through universal programs.
Targeting welfare
While there are different academic attempts at classifying the
design of welfare states, Australian academic Peter
Whiteford has suggested there are 3 main approaches:
- contributory – support is distributed based on individuals’ contributions
- universal – benefits are a right of citizenship
- targeted/selective – benefits are provided based on need.
Most countries combine these approaches. For example, in
Australia, income support is targeted to those in need through means testing, mandatory
superannuation has been legislated to provide retirement incomes based on
contributions, and the NDIS and Medicare are universally available to citizens
and permanent residents. Within these broad approaches there may be a further
blending of approaches: the NDIS may be considered ‘universal’ in that there is
no means test, but it is targeted to specific categories of need through
disability eligibility criteria. Whiteford
writes that it is the balance between these 3 approaches that characterises
welfare regimes.
Contributory schemes are often framed as a form of insurance
against risks to an individual’s income such as disability, unemployment and
old age. Targeted schemes are often framed as a means of poverty reduction or a
safety net. Within the insurance frame, income tax and contributions may be
considered as premiums. In the safety net frame, tax revenue is not considered in
direct connection to the welfare programs it funds.
Australia relies much more heavily on means testing than
other developed countries (OECD,
p. 13; Whiteford).
Most other OECD countries have c ontributory social insurance systems alongside
targeted benefits for those who cannot access the contributory schemes. OECD data shows that some countries, such as the Nordic states, make greater use of universal
benefits alongside contributory social insurance.
Targeting in the Australian welfare state
A long history of means testing
Means testing as a way of targeting welfare has been a
feature of the Australia welfare system since the first social security payment,
the Old-Age Pension, was created in 1908. This payment had eligibility
conditions related to age, residency and character, but the decision to include
a means test was contentious. Opponents
to means testing argued that it was a ‘charity dole’ and stigmatised
recipients as paupers, while proponents argued that it should be considered a
retirement allowance earned
through contributions to the community during the recipient’s working life. Cost
was the main reason for not implementing a universal scheme (p. 7). At
the time, the
Constitution limited the federal government’s avenues for raising revenue
(pp. 66–67).
Governments have
subsequently proposed versions of contributory social insurance schemes or
specific tax contributions to fund social services (pp. 8–13). The pension
means test was eased in the period from 1948 to 1976, and was briefly
abolished for those aged over 70. However, this trend has since reversed, with
ongoing concern over growing expenditure on an ageing population (pp. 30–31).
Means testing was applied to other payment categories as the
Australian welfare state expanded. Family payments were initially universal
payments, but have gradually become subject to targeting. Now, all the main
Australian Government payments are subject to means testing – even those
intended to support workers, such as Child Care Subsidy and Parental Leave Pay.
Figure 1 sets out the array of payments and social services
and whether they are targeted through means testing. Each program has a
different means test containing multiple thresholds, taper rates and payment
rates. The ways in which means are assessed can also vary, with different
definitions of income used for social security and family
payments.
Figure 1 Targeting Australian Government social
spending through means tests
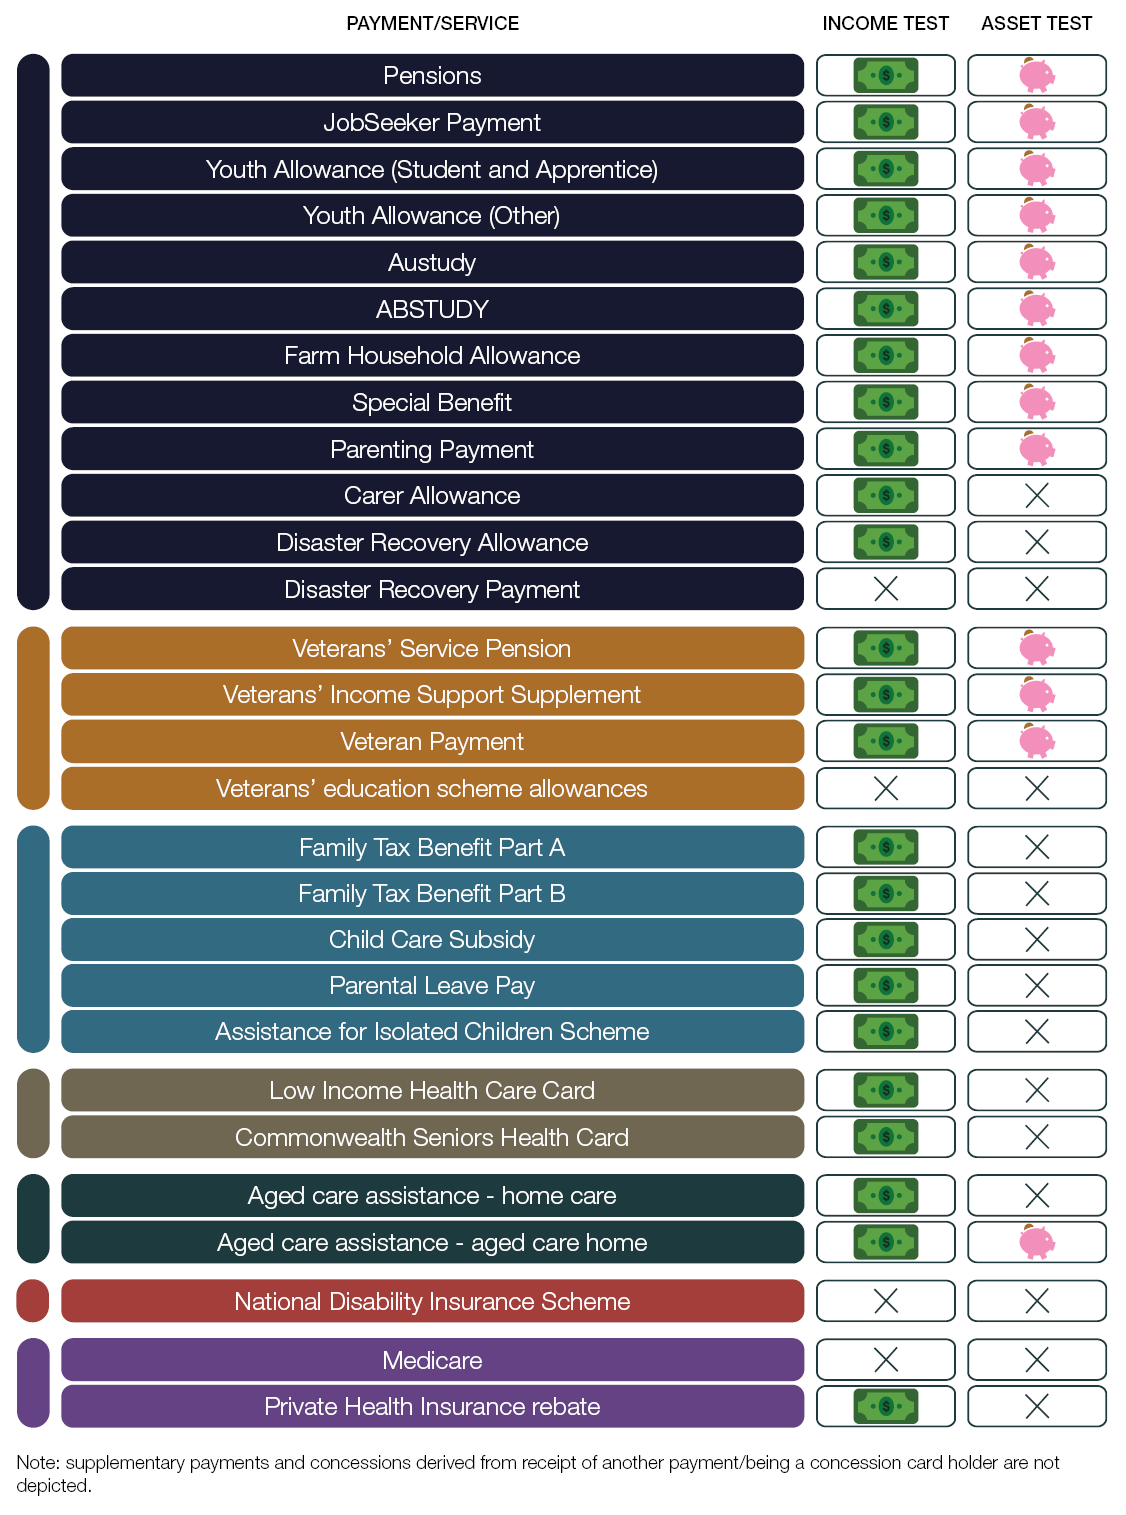
Source: Parliamentary Library
Narrowing the target
While the means test for the Age Pension is intended to
target those without adequate means to support themselves, a majority of those
who meet the age criteria (currently 67 years or older) receive the payment. In
2022–23, around 64% of the resident
pension age population received the Age Pension and 71% received some form
of income support (p. 168 and chart
data for Chart 7.20). Around 44% of those above pension age receiving a
government payment received the maximum payment rate. These percentages have remained
fairly steady over the last 30 years. However, Treasury expects that over the
next 40 years, as retirees with higher superannuation balances encounter the means
test, the proportion of this age group receiving a pension will decline to
around 57%, with only 21% of recipients receiving the maximum rate (Figure 2).
Figure 2 Persons of Age Pension eligible age by pension
recipient category
Note: Includes receipt of any government income support pension
including Age Pension, Disability Support Pension, Carer Payment and Service
Pension.
Source: Australian Government, 2023
Intergenerational Report, (Canberra: The Treasury, 2023), 168
and linked chart data for Chart 7.20.
Tightened
means testing has resulted in a reduction of the proportion of children
being supported through family payments. What was once an almost universal
payment – with around 80.5% of children aged under 16 attracting Family Tax
Benefit Part A in 2003–04 – is now paid only to lower income families, with an
estimated 44.7% of children under 16 being supported by the payment in 2021–22
(Figure 3).
Figure 3 Family Tax Benefit Part A children as a
proportion of the population by age group
Note: Unique count of children attracting Family Tax Benefit
Part A in the entitlement year, age at 30 June.
*Data for most years as at quarter 8 (2 years) after
entitlement year to allow for reconciliation, however the year 2021–22 is as at
quarter 6 and is not yet mature. ABS 3101.0 National, state and territory
population, Table 59. Estimated resident population at 30 June each year.
Source: Economic Inclusion Advisory Committee, 2024
Report to Government, (Canberra: Department of Social Services, 2024), 93. Chart data provided by the Department of Social Services.
Recent decisions: funding the NDIS and aged care
There have been various proposals over the last 15 years to
address the growing need for, and cost of, disability and aged care services.
The 2011
Productivity Commission report that guided the establishment of the NDIS
stated that it would be ‘inequitable and inefficient’ to apply a means test – inefficient
because it would exclude high-income people from the most efficient form of
insurance against a severe disability, and inequitable because higher income
people could not access a scheme they had helped fund (p. 262). The commission
argued that ‘the well-off would pay a much larger contribution towards the NDIS
than medium and low income earners’ under its preferred funding model: Australia’s
progressive tax system (p. 262). The commission also argued that means
testing would create disincentives for work and savings.
However, the commission argued that disability care accessed
after Age Pension age should require a means-tested co-contribution, in
the same way as aged care services (p. 17). In this depiction, the
universal disability scheme provides an efficient public insurance model while
the targeted scheme promotes private savings to cover the inevitable care costs
in old age.
The NDIS co-contribution for older participants was never
implemented, but those older than pension age cannot apply for NDIS supports.
Recent
changes to the NDIS aimed at reducing expenditure growth have involved
targeting the range and level of supports offered: by further specifying funded
and excluded services, and changing the structure of participants’ budgets.
The 2021
Aged Care Royal Commission reconsidered the co-contribution model and recommended
establishing an income tax levy to fund universal aged care (pp. 301, 309).
However, the Morrison and Albanese governments decided against the proposed
levy and universal model.
The 2024
Aged Care Taskforce report provided a rationale for not implementing a
specific tax increase to fund aged care:
There are substantial
intergenerational equity issues in asking the working age population, which is
becoming proportionally smaller to pay for these services. Moreover,
superannuation has been designed to support people to grow their wealth and
fund the costs associated with retirement including aged care. (p. 20)
The taskforce supported increasing co-contributions through
a means test to help fund growing aged care costs (p. 20), but did not
consider alternatives, such as changes to tax concessions for superannuation,
so that wealthy older people could indirectly contribute more to funding aged
care.
Current debates – universal child care
In 2023, the Albanese Government tasked
the Productivity Commission with analysing a shift to universal early
childhood education and care ‘in the great tradition of universal Medicare and
universal superannuation’ (p. v).
The commission’s
final report presented a universal system as one where all children have access to high-quality services (p. 4). The proposed system retained a
means-tested subsidy with higher levels of support to low-income families,
removed activity-testing and contained measures to improve the supply of child
care places (pp. 5–7). The commission found non-means tested options would
involve greater increases in government expenditure, with most of the benefits
and increased demand for child care going to higher income families (pp. 33–34).
However, the non-means tested options would see a stronger (though small) increase
in labour market activity from parents, compared to its preferred option (p. 37).
International responses to pressure on welfare
systems
Contributory pension schemes in Europe, which rely on the
contributions of current workers to fund the pensions of retirees, are
under increased financial pressure due to smaller ratios of workers to
retirees. Most
OECD countries have increased pension ages and shifted occupational pension
schemes from defined benefit to defined contribution models (pp. 42–45; 47).
The UK’s welfare system, which combines contributory,
means-tested and universal elements, has seen the gradual
decline of contributory benefits. Contributory payments to working-age
people have declined from around a third of welfare benefits (including tax
credits) in the late 1970s to around 8% in 2019–20. Benefits for retirees were
following the same trend, but policy changes in the 2000s and 2010s have
restored the basic state pension as a flat-rate, non-means tested payment for
most retirees, which can be topped up with means-tested additional support or
private savings.
Other countries are implementing universal programs. In
2021, the Canadian
Government announced a plan for a universal child care system with average
out-of-pocket costs at $10 per day and 250,000
new places by 2026. Some academics
have questioned whether the goal can be achieved and whether there will be
enough additional places to meet increased demand.
How social spending compares
Australia’s use of targeting has kept its public
social spending, including on health, close to the OECD average – at 20.5%
of GDP in 2019 (the most recent comparable data). However, when private social
spending (such as superannuation contributions) and a variety of tax
concessions are included – what the OECD describes as ‘net social spending’ – Australia
is one of the biggest social spenders at 24.9% of GDP (ranked sixth) (Figure 4).
These tax
concessions often benefit higher income earners (because they have higher
tax liabilities) and low-income workers often miss out on private social
benefits.
Figure 4 Public and net total social expenditure,
% of GDP 2019
Notes: ‘Gross public expenditure’ refers to total direct public
spending on benefits and services. ‘Net total social expenditure’ includes social
benefits delivered through the private sector such as superannuation, and tax
expenditures which deliver social supports such as tax credits for dependent
children. The numbers in brackets refer to country rankings in terms of gross
public and net total social expenditure, with number one being the highest
spender. For example, the US ranks 23rd in the OECD in term of gross public
social expenditure and second in terms of net total social expenditure.
Source: OECD
Social Expenditure database 2023
Future directions
Countries around the world are responding to economic,
demographic and environmental challenges to their welfare states in a variety
of ways – through greater targeting, through universalism, and through hybrid
approaches.
In Australia’s case, some commentators and international
bodies have argued that budget pressures create the need for more private
spending and means testing of social supports (p. 31). While this can
improve the government’s fiscal balance, it shifts costs onto individuals and
families and will see some miss out on the support they need.
Expanding social spending and creating more universal
supports would require more tax revenue or government debt. Universal systems provide
broader coverage against risks to wellbeing and income, are simpler to navigate
and administer, and remove the stigma attached to means-tested welfare.
However, universal systems have finite resources – supports may be rationed
(through waiting lists or eligibility criteria) and broader coverage can limit
the level of support provided. Additional support to high-need groups is often
necessary.
In meeting the challenges, policymakers will need to consider:
- What are the social objectives of welfare policy – an investment
in the wellbeing of Australians; insurance against risks to income and
wellbeing; reducing poverty or inequality; as a safety net of last resort; or a
combination of these?
- How should resources be redistributed to fund welfare policies – from
the rich to the poor; across generations; from workers to those unable to work?
- What are the most effective and efficient mechanisms for
achieving the objectives and redistributing resources?
Further reading
- Don Arthur, Myths
of Entitlement: A History of the Age Pension and the National Welfare Fund,
Research paper series, 2021–22, (Canberra: Parliamentary Library, 2021).
- Ben Spies-Butcher, Politics,
Inequality and the Australian Welfare State after Liberalisation (London:
Anthem Press, 2023).
- Dimitri Gugushvili and Tijs Laenen, ‘Two Decades after Korpi and Palme’s “Paradox of Redistribution”:
What Have We Learned So Far and Where Do We Take it From Here?’, Journal of International and Comparative Social Policy 37, no. 2 (July 2021): 112–127.