Geographic regions within Australia have different age profiles due to their unique economic, social and environmental characteristics. For example, areas with low housing costs and/or strong employment prospects are attractive to younger people, whilst retirees are often drawn to the coast. Age profiles can be used to assist in understanding the needs of different electorates in relation to childcare, education, and healthcare. This FlagPost shows the differing age profiles of selected electorates.
Statistics used in this FlagPost are from the unpublished Australian Bureau of Statistics population estimates 2020 (June quarter).
Three electorates with three very different age profiles
Lalor, Lingiari and Lyne are three electorates whose age profiles are very different to the Australian average.
Lalor in Victoria covers an area of relatively recent land releases of affordable housing and is attractive to many young families. It has the highest proportion of infants in any electorate, and it has a peak in the proportion of people in their early thirties representing the age of their parents.
Lyne is on the New South Wales mid-north coast and is a popular area for retirees. Lyne has the highest proportion of people aged 60 and over, the lowest proportions in their 20s and 30s, and the lowest proportion of infants. Lyne has the highest median age of 50.
Lingiari covers the entire Northern Territory (NT) except for the Darwin area. It has the highest proportion of primary school-aged children, but also has the lowest proportion aged 70 and over. The latter reflects the lower life-expectancy of Indigenous Australians who make up almost a third of the population of the NT. (see Figures 2 and 3)
Figure 1: selected electorates, age as a proportion of population, 2020
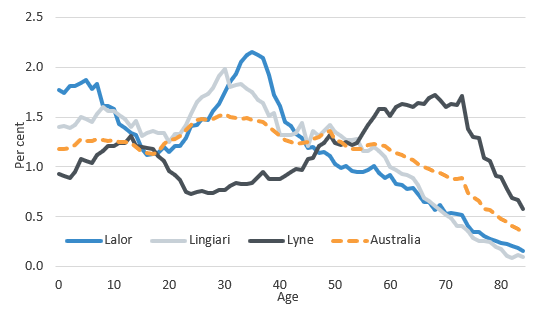
Source: Parliamentary Library estimates.
City versus rural age profiles
The Australian Electoral Commission (AEC) gives each electorate a demographic rating based on how urban or rural it is. Figure 2 shows that, as a group, inner-metropolitan electorates have profiles that diverge the most from the average. They have relatively low proportions of school-age children and very high proportions of young working-age people. In contrast, rural and provincial electorates have higher proportions of school-age children and people over 50 (for example: Parkes, Blair and Bass). Outer metropolitan electorates (for example: Kingston, Brand and Calwell) have a profile most closely matching that of Australia’s.
Figure 2: electorates grouped by AEC demographic, age as a proportion of population, 2020
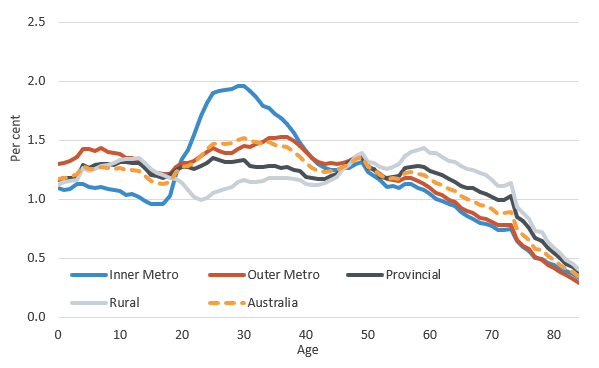
Source: Parliamentary Library estimates
Younger workers in city electorates
The electorates located in the centre of the five largest state capitals have profiles reflecting their population of younger workers (popular industries are cafés and restaurants, education, health, and computer system design and related services). Figure 3 shows the bigger the city, the more concentrated is this peak. Their age profiles are all below Australia’s for infants, school-aged children, and people over 45. The Seat of Melbourne has the lowest median of 30.
Figure 3: selected inner metropolitan electorates, age as a proportion of population, 2020

Source: Parliamentary Library estimates
Note that the y-axis in Figure 3 is twice that of Figures 1 and 2 which means the peaks of the city electorates are around double that of the peaks in the other charts.
The electorates central to Hobart, Canberra and Darwin (Clark, Canberra and Solomon, respectively) have been excluded as they cover more than just their inner-city areas.
Many people change where they live according to their circumstances or goals. A younger voter may move to a city for a few years, then move to an area where houses are more affordable to start raising a family. A person may retire to a coastal area. These changes are then reflected in the changing relative importance given by individuals and electorates to different policy issues (such as home affordability, social services and superannuation) over time.
Members of Parliament and their staff interested to know the age profile of their electorate can contact the Parliamentary Library to discuss in more detail.