17 November 2017
PDF version [264KB]
Geoff
Gilfillan
Statistics and Mapping Section
Executive
summary
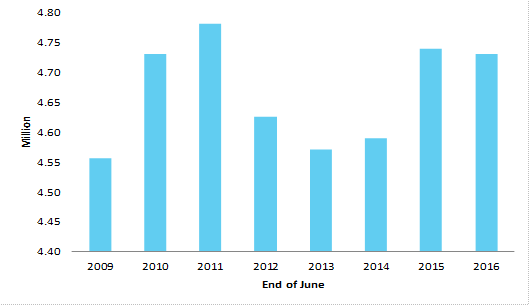
- In June 2016 there were just over 4.7 million people employed by
small businesses in Australia.
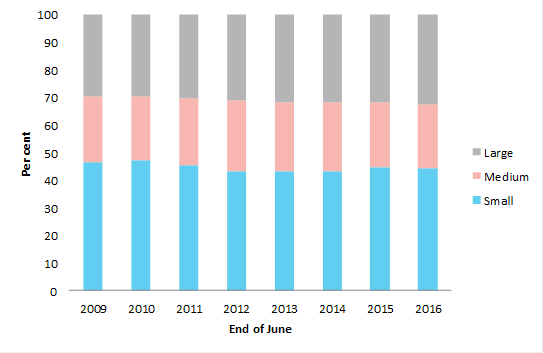
- Employees of small businesses accounted for just over 44 per cent
of all employed persons in the private sector. Larger businesses accounted for
just under a third (32 per cent) while medium sized businesses accounted for
just under a quarter (23 per cent).
- Industry value added of the small business sector expanded to $378.4
billion in the 12 months to June 2016 which was equivalent to a 35 per cent
share of total industry value added in Australia.
- Wages and salaries of small business employees accounted for 28
per cent of total wages and salaries paid in the private sector in the 12
months to the end of June 2016.
- The
lower share of total wages and salaries recorded by the small business sector
relative to their employment share (28 per cent versus 44 per cent) could be due
to the greater use by small businesses of casual employees on a part‑time
basis
- Average
wages in the small business sector may also be affected by the presence of
working proprietors and partners of unincorporated businesses among small
business employee numbers.
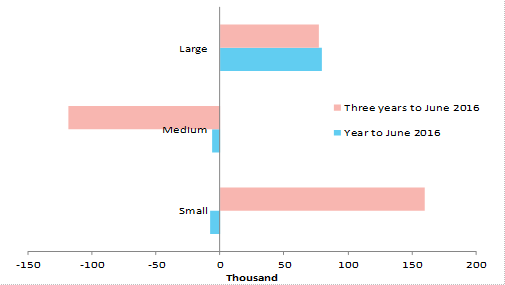
- In the three years to June 2016, small business employment
increased by 160,000. In contrast, employment in medium sized businesses fell
by 118,000 and employment in large firms increased by 77,000.
- In the 12 months to June 2016, employment in small and medium
sized businesses fell marginally by 8,000 and 6,000 respectively while
employment in large businesses increased by 80,000.
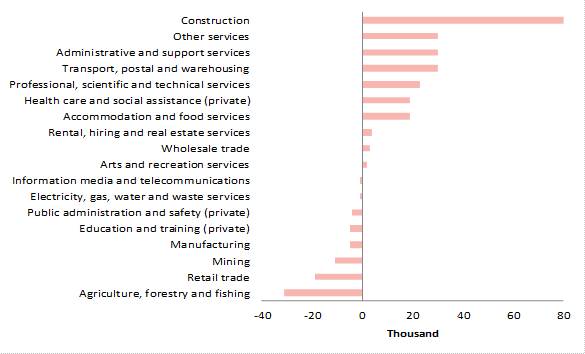
- Employment growth for small businesses in the three years to June
2016 has been strongest in the construction sector (up by 80,000).
- New South Wales and Victoria experienced the biggest increases in
small business employment in the three years to June 2016 (up 108,000 and
63,000 respectively) while South Australia and Western Australia experienced
the biggest falls (down 19,000 and 18,000 respectively).
- Small businesses have relatively high shares of total employment
in industries such as Agriculture, forestry and fishing (80.0 per cent in June
2016), Rental, hiring and real estate services (77.0 per cent), Construction
(68.6 per cent) and Other services (65.5 per cent).
Contents
Executive
summary
Introduction
What is a small business?
Small business contribution to
private sector employment
Figure 1: number of people employed
by small businesses
Figure 2: change in private sector
employment by firm size—one year and three years to June 2016
Figure 3: share of total private
sector employment by firm size
Small business share of employment in
selected industries
Table 1: small business share of
total private sector employment by industry—June 2009 and June 2016
Figure 4: change in small business
employment by industry—three years to end of June 2016
Figure 5: small business share of
total private sector employment by state and territory—end of June 2016
Figure 6: change in small business
employment by state and territory
Small business contribution to the
economy
Figure 7: Total Industry Value Added (IVA)
in the small business sector
Average annual wages by firm size
Figure 8: small business share of
total private sector employment, IVA and wages and salaries
Table 2: average annual real wages
for workers in small, medium and large enterprises ($ per annum)
Conclusion
Introduction
Small business has been cited in the past as
the driver of much of Australia’s employment and economic growth.[1]
Earlier research showed young Small and Medium Enterprises (SMEs) aged up to
five years in Australia accounted for over 40 per cent of all jobs created
between 2006 and 2011 and 31 per cent of total job growth was accounted for by
mature SMEs.[2]
This statistical snapshot seeks to update the contribution of small businesses
to the Australian economy.
What is a small
business?
Various organisations and legislation use different
definitions of small business. The Fair Work Act 2009 defines a small business
employer as an organisation that employs fewer than 15 people. The Australian
Taxation Office (ATO) defines a small business as a firm that has annual
revenue turnover (excluding GST) of up to $2 million. The Australian Securities
and Investment Commission (ASIC) regulates many businesses that are 'small
proprietary companies', that are defined as companies with at least two out of
the following three characteristics: an annual revenue of less than $25 million;
fewer than 50 employees at the end of the financial year; and consolidated
gross assets of less than $12.5 million at the end of the financial year.
In this statistical snapshot we use the ABS
definition of small businesses—those employing fewer than 20 people. Categories
of small businesses under the ABS definition include:
- Non‑employing businesses (sole
proprietorships and partnerships without employees)
- Micro‑businesses (businesses employing
between 1 and 4 people including non‑employing businesses)
- Other small businesses (businesses that employ
between 5 and 19 employees)
The ABS defines a medium sized business as one
that employ between 20 and 199 employees while large businesses employ 200 or
more employees.
Small
business contribution to private sector employment
Data from the ABS Australian Industry
publication shows there were 4,730,000 people employed by small businesses in
Australia at the end of June 2016. [3]
Figure 1: number
of people employed by small businesses
Source: ABS, Australian Industry, cat. no. 8155.0
In the three years to the end of June 2016, small business
employment increased by 160,000 while employment in medium sized businesses
fell by 118,000 and employment in large firms increased by 77,000.
Figure 2: change in private sector employment by firm size—one year and three years to June 2016
Source: ABS, Australian Industry, cat. no. 8155.0
However, in the 12 months to the end of June 2016,
employment in small and medium sized businesses fell marginally (by 8,000 and
6,000 respectively) while employment in large businesses increased by 80,000.
The small business share of total private sector employment
has fallen marginally over the past seven years. Small business employees accounted
for 44.3 per cent of all persons employed in the private sector in Australia at
the end of June 2016—down slightly from 46.4 per cent in June 2009.
Medium sized businesses accounted for just under a quarter
(23 per cent) of all employed persons at the end of June 2016 and large firms
accounted for just under a third (32 per cent).
Figure 3: share
of total private sector employment by firm size
Source: ABS, Australian Industry, cat. no. 8155.0
Small
business share of employment in selected industries
Small businesses having high shares of total employment in
industries include Agriculture, forestry and fishing (80.0 per cent in June
2016), Rental, hiring and real estate services (77.0 per cent), Construction
(68.6 per cent) and Other services (65.5 per cent).
Small business employment shares are much lower in capital
intensive industries such as Mining and Electricity, gas, water and waste
services (see Table 1).
The small business share of total employment in
Accommodation and food services fell from 55.1 per cent in June 2009 to 46.2
per cent in June 2016. Smaller reductions in small business sector shares of
total employment were recorded over the interval in Agriculture, forestry and
fishing; Mining; Construction; Professional, scientific and technical services;
Public administration and safety (private) and Arts and recreation services. In
contrast, small rises in the small business share of total employment were
recorded in Manufacturing; Administrative and support services; and Health care
and social assistance (private).
Table 1: small
business share of total private sector employment by industry—June 2009 and June
2016
|
|
Small business
share of total
employment (%) |
End of June
2009 |
End of June
2016 |
| Agriculture, forestry and fishing |
84.1 |
80.0 |
| Mining |
14.8 |
8.0 |
| Manufacturing |
29.9 |
31.0 |
| Electricity, gas, water and waste services |
14.8 |
14.3 |
| Construction |
70.9 |
68.6 |
| Wholesale trade |
34.8 |
34.3 |
| Retail trade |
38.3 |
34.7 |
| Accommodation and food services |
55.1 |
46.2 |
| Transport, postal and warehousing |
44.0 |
44.0 |
| Information media and telecommunications |
19.7 |
20.0 |
| Rental, hiring and real estate services |
76.6 |
77.0 |
| Professional, scientific and technical services |
55.9 |
52.8 |
| Administrative and support services |
32.8 |
34.0 |
| Public administration and safety (private) |
25.8 |
21.8 |
| Education and training (private) |
25.1 |
23.4 |
| Health care and social assistance (private) |
30.7 |
31.6 |
| Arts and recreation services |
40.2 |
37.8 |
| Other services |
65.8 |
65.5 |
| TOTAL |
46.4 |
44.3 |
Source: ABS, Australian Industry, cat. no. 8155.0
Employment growth for small business in the three years to the
end of June 2016 has been strongest in Construction (up by 80,000) followed by Other
services (up 30,000), Administrative and support services (up 30,000) and Transport,
postal and warehousing (up 30,000). Employment loss for small businesses has
been greatest in Agriculture, forestry and fishing (down 31,000), Retail trade
(down 19,000) and Mining (down 11,000).
Figure 4: change
in small business employment by industry—three years to end of June 2016
Source: ABS, Australian Industry, cat. no. 8155.0
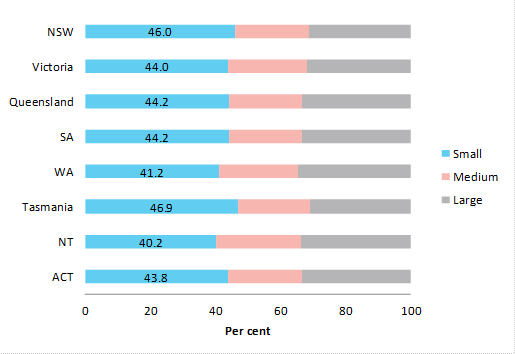
Tasmania had the highest small business share of total
employment at the end of June 2016 (at 46.9 per cent) while the Northern
Territory had the lowest (40.2 per cent).
Figure 5: small
business share of total private sector employment by state and territory—end of
June 2016
Source: ABS, Australian Industry, cat. no. 8155.0
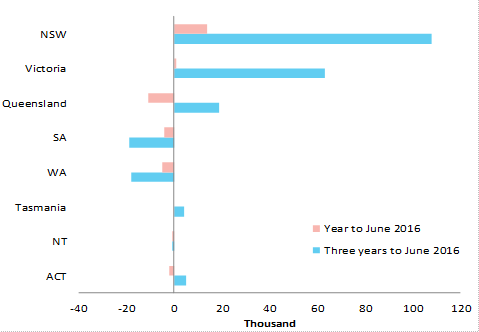
New South Wales and Victoria experienced the biggest
increases in small business employment in the three years to the end of June
2016 (up 108,000 and 63,000 respectively) while South Australia and Western
Australia experienced the biggest falls (down 19,000 and 18,000 respectively).
Figure 6: change
in small business employment by state and territory
Source: ABS, Australian Industry, cat. no. 8155.0
(unpublished data)
Small
business contribution to the economy
Industry Value Added (IVA) is the private industry
contribution to the economy. IVA is an estimate of the difference between the
market value of the output of an industry and the purchases of materials and
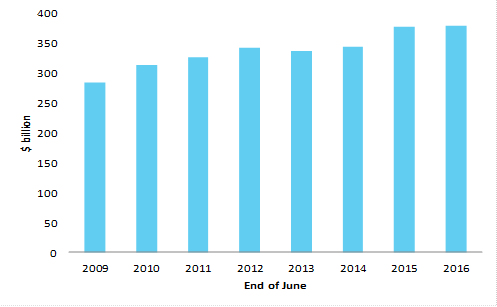
expenses incurred in the production of that output. Total IVA for the small
business sector hovered between $326 billion and $342 billion per year from 2010–11
to 2013–14. Industry output in the small business sector grew substantially by
$33.5 billion or 9.8 per cent in the 12 months to the end of June 2015 and by a
more modest $2.6 billion or 0.7 per cent in the 12 months to the end of June
2016 to $378.4 billion.
Figure 7: Total
Industry Value Added (IVA) in the small business sector
Source: ABS, Australian Industry, cat. no. 8155.0
Average
annual wages by firm size
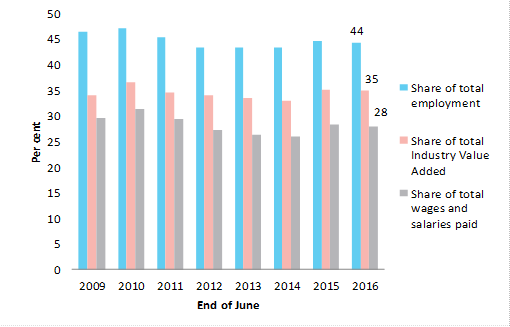
The following chart shows the small business share of total private
sector employment, total IVA and total wages and salaries paid in the private
sector. The small business sector accounted for just over 44 per cent of total
private sector employment, 35 per cent of total IVA and only 28 per cent of
total wages and salaries paid in the private sector in the 12 months to the end
of June 2016.
Figure 8: small
business share of total private sector employment, IVA and wages and salaries
Source: ABS, Australian Industry, cat. no. 8155.0
The following table shows average annual wages and salaries paid
for workers in small, medium and large enterprises between 2008–2009 and 2015–2016
expressed in June 2016 dollars.
Table 2: average
annual real wages for workers in small, medium and large enterprises ($ per
annum)
| |
Change: 2008-09 to
2015-16 |
| |
2008-09 |
2009-10 |
2010-11 |
2011-12 |
2012-13 |
2013-14 |
2014-15 |
2015-16 |
dollars |
Per cent |
| Small |
$29,803 |
$30,633 |
$29,603 |
$30,072 |
$29,687 |
$29,443 |
$31,683 |
$31,893 |
$2,090 |
7.0 |
| Medium |
$55,891 |
$52,691 |
$52,363 |
$53,098 |
$55,314 |
$57,165 |
$56,955 |
$58,476 |
$2,586 |
4.6 |
| Large |
$66,393 |
$64,839 |
$64,542 |
$68,872 |
$70,259 |
$70,464 |
$70,256 |
$70,275 |
$3,882 |
5.8 |
Source: ABS, Australian Industry, cat. no. 8155.0;
ABS, Consumer Price Index, cat. no. 6401.0 (Parliamentary Library calculations).
Note: Expressed in June 2016 dollars and includes working proprietors.
Average annual real wages for workers in large and medium
enterprises are much higher than those recorded for workers in small
enterprises. The results may reflect differences in average hours worked by
employed people and different skill sets of workers in different sized firms.
For example, there may be a higher percentage of people working in casual
part–time positions in small businesses compared with medium and large
enterprises. And workers in smaller firms may be less skilled on average than
workers in larger firms. Unfortunately ABS data is currently not available on
the composition of full and part–time employment and access to leave
entitlements of employees by firm size and industry. Point–in–time estimates
for wages and salaries may also be affected by seasonal factors.
It should also be noted that a proportion of people employed
in small businesses are working proprietors who may or may not be drawing a
wage as an employee of their business. For example, ABS data shows just over 10
per cent of employed people in Professional, scientific and technical services
were working proprietors in June 2016. The working proprietor share could be
much higher or lower in other industries which could affect the averages for
wages and salaries paid in each industry sector.
Growth in average wages and salaries for workers in small
enterprises was slightly higher in real terms between 2008–09 and 2015–16 (at
7.0 per cent) than growth in average wages for workers in medium and large
firms (at 4.6 per cent and 5.8 per cent respectively).
Conclusion
The most recent data available shows the small business
sector makes an important contribution to private sector employment and
industry value added in Australia. But this finding should not ignore the
equally important influence and involvement of medium and larger sized
enterprises in driving employment and output growth.
[1]
The
engine of the Australian economy, Treasury, Budget 2015.
[2]
Hendrickson, L., Bucifal, S., Balaguer, A., and Hansell, D., The
employment dynamics of Australian entrepreneurship, Research Paper 4/2015
[3]
The estimates included in Australian Industry publication are produced at
the end of each financial year using a combination of data collected directly
from the annual Economic Activity Survey (EAS), conducted by the Australian
Bureau of Statistics (ABS), and Business Activity Statement (BAS) data provided
by businesses to the Australian Taxation Office (ATO)
For copyright reasons some linked items are only available to members of Parliament.
© Commonwealth of Australia
Creative Commons
In essence, you are free to copy and communicate this work in its current form for all non-commercial purposes, as long as you attribute the work to the author and abide by the other licence terms. The work cannot be adapted or modified in any way. Content from this publication should be attributed in the following way: Author(s), Title of publication, Series Name and No, Publisher, Date.
To the extent that copyright subsists in third party quotes it remains with the original owner and permission may be required to reuse the material.
Inquiries regarding the licence and any use of the publication are welcome to webmanager@aph.gov.au.
This work has been prepared to support the work of the Australian Parliament using information available at the time of production. The views expressed do not reflect an official position of the Parliamentary Library, nor do they constitute professional legal opinion.
Any concerns or complaints should be directed to the Parliamentary Librarian. Parliamentary Library staff are available to discuss the contents of publications with Senators and Members and their staff. To access this service, clients may contact the author or the Library‘s Central Enquiry Point for referral.