|
2008-09
|
2009-10
|
2010-11
|
2011-12
|
2012-13
|
| Gross state product, chain volume measures (a) – $ million |
|
|
|
| New South Wales |
433 894
|
441 855
|
452 128
|
462 831
|
471 354
|
| Victoria |
307 448
|
312 384
|
319 295
|
328 285
|
333 393
|
| Queensland |
266 655
|
270 202
|
272 561
|
284 441
|
294 548
|
| South Australia |
88 333
|
89 382
|
91 411
|
93 031
|
94 210
|
| Western Australia |
206 772
|
215 493
|
224 340
|
240 811
|
252 999
|
| Tasmania |
24 098
|
24 144
|
24 235
|
24 342
|
24 191
|
| Northern Territory |
17 444
|
17 664
|
18 002
|
18 813
|
19 860
|
| Australian Capital Territory |
30 460
|
31 394
|
32 336
|
33 517
|
34 414
|
| Australia |
1 375 809
|
1 402 813
|
1 434 227
|
1 486 072
|
1 524 969
|
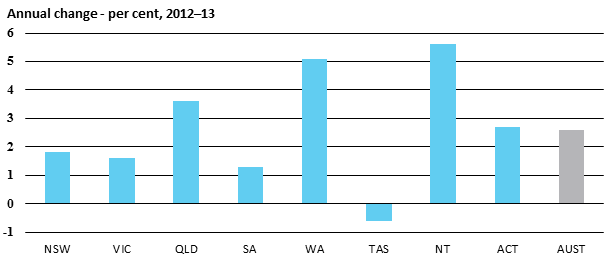
| Annual change – per cent |
|
|
|
|
| New South Wales |
1.1
|
1.8
|
2.3
|
2.4
|
1.8
|
| Victoria |
1.1
|
1.6
|
2.2
|
2.8
|
1.6
|
| Queensland |
1.1
|
1.3
|
0.9
|
4.4
|
3.6
|
| South Australia |
2.3
|
1.2
|
2.3
|
1.8
|
1.3
|
| Western Australia |
4.3
|
4.2
|
4.1
|
7.3
|
5.1
|
| Tasmania |
2.5
|
0.2
|
0.4
|
0.4
|
-0.6
|
| Northern Territory |
4.9
|
1.3
|
1.9
|
4.5
|
5.6
|
| Australian Capital Territory |
4.2
|
3.1
|
3.0
|
3.7
|
2.7
|
| Australia |
1.7
|
2.0
|
2.2
|
3.6
|
2.6
|
|
|
|
|
|
|
| (a) Reference year for chain volume measures is 2011–12. |
|
|
|
| Source: ABS, Australian National Accounts: State Accounts, Cat. no. 5220.0, 2012-13 |
3.2 Gross state product per capita

|
2008-09
|
2009-10
|
2010-11
|
2011-12
|
2012-13
|
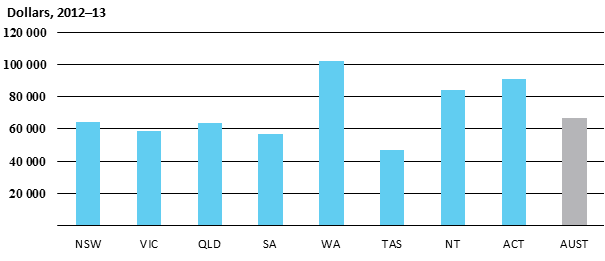
| Gross state product per capita, chain volume measures (a) $ |
|
|
| New South Wales |
61 969
|
62 220
|
62 971
|
63 739
|
64 098
|
| Victoria |
57 864
|
57 643
|
58 099
|
58 806
|
58 682
|
| Queensland |
62 367
|
61 867
|
61 431
|
62 943
|
63 840
|
| South Australia |
55 281
|
55 223
|
55 995
|
56 485
|
56 674
|
| Western Australia |
93 607
|
95 193
|
96 737
|
100 697
|
102 232
|
| Tasmania |
48 025
|
47 671
|
47 499
|
47 547
|
47 222
|
| Northern Territory |
78 392
|
77 547
|
78 168
|
80 844
|
83 828
|
| Australian Capital Territory |
86 756
|
87 726
|
88 633
|
90 292
|
90 631
|
| Australia |
64 072
|
64 165
|
64 694
|
65 997
|
66 549
|
| Annual change – per cent |
|
|
|
|
|
| New South Wales |
-0.6
|
0.4
|
1.2
|
1.2
|
0.6
|
| Victoria |
-1.0
|
-0.4
|
0.8
|
1.2
|
-0.2
|
| Queensland |
-1.6
|
-0.8
|
-0.7
|
2.5
|
1.4
|
| South Australia |
1.0
|
-0.1
|
1.4
|
0.9
|
0.3
|
| Western Australia |
0.8
|
1.7
|
1.6
|
4.1
|
1.5
|
| Tasmania |
1.3
|
-0.7
|
-0.4
|
0.1
|
-0.7
|
| Northern Territory |
2.1
|
-1.1
|
0.8
|
3.4
|
3.7
|
| Australian Capital Territory |
2.2
|
1.1
|
1.0
|
1.9
|
0.4
|
| Australia |
-0.4
|
0.1
|
0.8
|
2.0
|
0.8
|
|
|
|
|
|
|
| (a) Reference year for chain volume measures is 2011–12. |
|
|
|
| Source: ABS, Australian National Accounts: State Accounts, Cat. no. 5220.0, 2012-13 |

|
2008-09
|
2009-10
|
2010-11
|
2011-12
|
2012-13
|
|
|
|
|
|
|
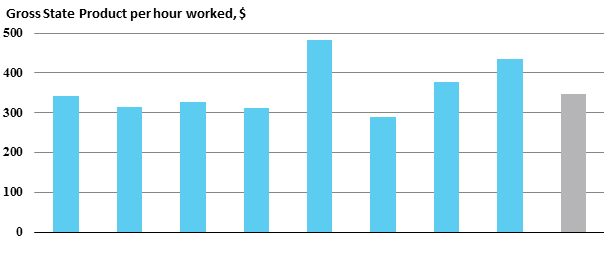
| Gross State Product per hour worked, $ |
|
|
|
| New South Wales |
320.8
|
328.1
|
327.7
|
339.6
|
340.6
|
| Victoria |
300.4
|
297.7
|
292.5
|
309.1
|
313.3
|
| Queensland |
297.5
|
303.0
|
302.6
|
313.1
|
327.7
|
| South Australia |
289.8
|
297.7
|
294.6
|
307.2
|
312.2
|
| Western Australia |
430.8
|
459.6
|
456.0
|
471.0
|
483.1
|
| Tasmania |
264.2
|
275.0
|
271.0
|
283.7
|
287.8
|
| Northern Territory |
354.7
|
349.6
|
347.2
|
361.7
|
376.1
|
| Australian Capital Territory |
395.4
|
401.9
|
404.7
|
426.1
|
435.6
|
| Australia |
321.9
|
328.2
|
326.3
|
340.6
|
347.5
|
|
|
|
|
|
|
| Annual change – per cent |
|
|
|
|
|
| New South Wales |
1.8%
|
2.3%
|
-0.1%
|
3.7%
|
0.3%
|
| Victoria |
2.3%
|
-0.9%
|
-1.7%
|
5.7%
|
1.3%
|
| Queensland |
-0.8%
|
1.8%
|
-0.1%
|
3.5%
|
4.6%
|
| South Australia |
2.2%
|
2.7%
|
-1.0%
|
4.3%
|
1.6%
|
| Western Australia |
1.7%
|
6.7%
|
-0.8%
|
3.3%
|
2.6%
|
| Tasmania |
2.2%
|
4.1%
|
-1.5%
|
4.7%
|
1.4%
|
| Northern Territory |
3.3%
|
-1.4%
|
-0.7%
|
4.2%
|
4.0%
|
| Australian Capital Territory |
3.9%
|
1.6%
|
0.7%
|
5.3%
|
2.2%
|
| Australia |
1.5%
|
2.0%
|
-0.6%
|
4.4%
|
2.0%
|
|
|
|
|
|
|
|
|
|
|
|
|
(a) Gross state product (chain volume measures) per hour worked, all sectors
(i.e. market and non-market sectors) |
Source: ABS, Australian National Accounts: State Accounts, Cat. no. 5220.0, 2012-13;
ABS, Labour Force, Detailed, Cat. No. 6291.0.55.001, August 2014 |
|
For copyright reasons some linked items are only available to members of Parliament.
© Commonwealth of Australia
Creative Commons
In essence, you are free to copy and communicate this work in its current form for all non-commercial purposes, as long as you attribute the work to the author and abide by the other licence terms. The work cannot be adapted or modified in any way. Content from this publication should be attributed in the following way: Author(s), Title of publication, Series Name and No, Publisher, Date.
To the extent that copyright subsists in third party quotes it remains with the original owner and permission may be required to reuse the material.
Inquiries regarding the licence and any use of the publication are welcome to webmanager@aph.gov.au.
This work has been prepared to support the work of the Australian Parliament using information available at the time of production. The views expressed do not reflect an official position of the Parliamentary Library, nor do they constitute professional legal opinion.
Any concerns or complaints should be directed to the Parliamentary Librarian. Parliamentary Library staff are available to discuss the contents of publications with Senators and Members and their staff. To access this service, clients may contact the author or the Library‘s Central Entry Point for referral.