Robert Dossor
In the 2013–14 Budget almost $24 billion is allocated to infrastructure spending. This spending includes funds allocated for large projects such as the Sydney F3 to M2 link, the Brisbane Cross River Rail project, and the Melbourne Metro rail expansion.[1]
The infrastructure component of this Budget, while smaller than the $36 billion infrastructure component of the 2012–13 Budget, includes a number of long term projects and fewer current projects, meaning less money will be spent on recurrent spending for ongoing projects.
The Budget includes a number of large projects which have long timelines such as the Melbourne Metro rail and Sydney’s F3 to M2 link. Of the almost $24 billion announced, only $18.8 billion is actually visible in the forward estimates.[2] This is probably because the timelines of these projects are longer than the forward estimates period. In addition, in cases where the Commonwealth funding is contingent on agreement being reached in the host state or territory, the funding may have been allocated to the contingency reserve.
The Budget measures: Budget Paper No: 2, 2013–14 explains that the Government will provide funding to most of the largest infrastructure projects from 2014–15 to 2018–19 under the Nation Building Program which goes beyond the forward estimates.[3]
Road and rail funding
The Budget makes a commitment to funding over $4.5 billion in rail infrastructure. This represents over 24 per cent of all infrastructure funding. Funding for roads exceeds $14 billion over the forward estimates, representing over three quarters of all infrastructure funding. A total of almost $73 million over the forward estimates is allocated to other projects, such as the Townsville Convention and Entertainment Centre and the National Partnership on liveable cities.[4]
Who gets what?
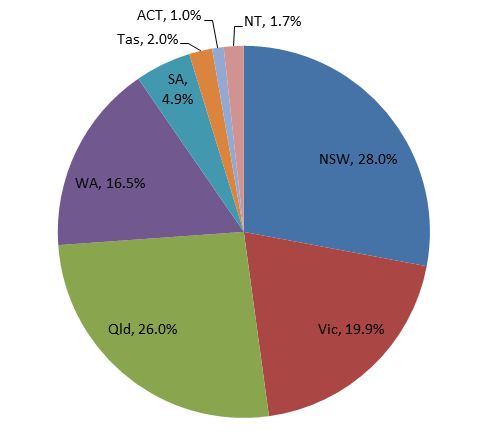
Chart: State/Territory share of infrastructure spending 2013–14 Budget

Source: Australian Government, Australia’s Federal Relations, budget paper no. 3, 2013–14, pp.84–92.
The chart above illustrates the infrastructure spending share for each state and territory. New South Wales receives the largest share at 28 per cent, closely followed by Queensland at 26 per cent. Queensland’s share which is significantly larger than its population share (at 20.1 per cent),[5] can be explained by the number of expensive, long term projects such as the Bruce Highway Package and the Brisbane Cross River Rail.[6] Victoria receives the next highest share with almost 20 per cent followed by Western Australia with 16.5 per cent, and South Australia with 4.9 per cent. Tasmania, the Australia Capital Territory and the Northern Territory each receive less than 3 per cent.[7]
Reduction of funds from Nation Building Program
Budget Paper No. 2 includes details of funds being deducted from the Nation Building Program next phase.[8] These funds are no longer allocated to projects within this program because of savings being achieved or projects changed, minimised or cancelled. $10 million from this fund is being used to fund the Heavy Vehicle Safety and Productivity Program which has been extended to include livestock transport.[9]
Mineral Resource Rent Tax
The Regional Infrastructure Fund, which the Government uses to fund regional infrastructure needs, will be reduced by some $2 billion over the forward estimates as a result of the lower than expected revenue arising from the Mineral Resource Rent Tax. This fund, however, will still fund over $2.2 billion in projects over the forward estimates.[10]
[4]. All figures obtained from Budget paper no. 3, op. cit., pp. 84–92.
[7]. Australia’s Federal Relations, budget paper no. 3, 2013–14, op. cit., pp. 84–92.
[8]. Budget measures: budget paper no. 2, 2013–14, op. cit., p. 225.
[10]. Australia’s Federal Relations, budget paper no. 3, 2013–14, op. cit., p. 92.
For copyright reasons some linked items are only available to members of Parliament.
© Commonwealth of Australia
In essence, you are free to copy and communicate this work in its current form for all non-commercial purposes, as long as you attribute the work to the author and abide by the other licence terms. The work cannot be adapted or modified in any way. Content from this publication should be attributed in the following way: Author(s), Title of publication, Series Name and No, Publisher, Date.
To the extent that copyright subsists in third party quotes it remains with the original owner and permission may be required to reuse the material.
Inquiries regarding the licence and any use of the publication are welcome to webmanager@aph.gov.au.
This work has been prepared to support the work of the Australian Parliament using information available at the time of production. The views expressed do not reflect an official position of the Parliamentary Library, nor do they constitute professional legal opinion.
Feedback is welcome and may be provided to: web.library@aph.gov.au. Any concerns or complaints should be directed to the Parliamentary Librarian. Parliamentary Library staff are available to discuss the contents of publications with Senators and Members and their staff. To access this service, clients may contact the author or the Library‘s Central Entry Point for referral.