Posted 02/05/2022 by Anna Hough
International comparisons
As of 1 January 2021 (the most recent figures at the time of publication), the Australian Parliament was ranked 73rd of 193 countries globally by the Inter-Parliamentary Union (IPU) for women in ministerial positions in national parliaments, with women then comprising 26.7% of the ministry. Unless otherwise stated, ministry and shadow ministry figures include non-Cabinet ministers but exclude assistant ministers (parliamentary secretaries).
In 2008 (the earliest year for which IPU data is available) Australia was ranked 29th globally for women in ministerial positions. Australia’s ranking fell to 90th in 2019 before rising to 55th in 2020, then falling again in 2021.
Across OECD countries in 2021 an average of 34% of national government ministerial positions were held by women. In 2021 women held 50% or more of ministerial positions in seven OECD countries: Austria, Belgium, Canada, Finland, France, Spain, and Sweden. Australia was also outperformed on this measure by the United States of America (46.2%) and New Zealand (40%).
The federal ministry and Cabinet in Australia
On 1 January 2022, the figure for women in the ministry was 30%, an increase of 17% since 2001. The proportion of women in Cabinet has risen from 6% 2001 to 33% 2022. (Since 1956, excluding the Whitlam ministry from 1972–75, only a proportion of the ministry have been members of Cabinet).
The current Morrison ministry has both the highest number (eight) and percentage (33%) of women in Cabinet to date.
The highest proportion of women in a ministry (as opposed to Cabinet) to date has been during the Rudd ministry in 2013, when women comprised 37% of ministers.
Figure 1 below shows the percentages of women in federal ministries and Cabinets between 2001 and 2022. Note that this data represents snapshots of ministries and Cabinets as of 1 January each year, and therefore does not reflect all iterations during this period, including the Rudd ministry discussed above.

Source: Australian Bureau of Statistics (ABS), ‘Gender Indicators, Australia’, and Parliamentary Library data. Reference point is 1 January each year. Ministry figures exclude assistant ministers/parliamentary secretaries.
The shadow ministry and shadow Cabinet
Women comprise 40% of the current Albanese shadow ministry. The current shadow Cabinet includes 11 female shadow Cabinet ministers (48%) – the highest number and percentage of women in a shadow Cabinet to date.
Trends in the gender composition of ministries and shadow ministries
Table 1 below shows the percentage of women in the ministry, Cabinet, shadow ministry and shadow Cabinet immediately following each election since 2001.
Table 1: Women in the ministry, Cabinet, shadow ministry and shadow Cabinet after each election: 2001 to 2019
| |
Ministry |
Cabinet |
Shadow Ministry |
Shadow Cabinet |
| Year |
% Women |
% Women |
% Women |
% Women |
| 2001 |
13.3 |
11.8 |
16.1 |
16.7 |
| 2004 |
20.0 |
17.6 |
23.3 |
23.5 |
| 2007 |
23.3 |
20.0 |
18.8 |
10.0 |
| 2010 |
20.0 |
20.0 |
18.8 |
10.0 |
| 2013 |
16.7 |
5.3 |
36.7 |
26.3 |
| 2016 |
23.3 |
26.1 |
40.6 |
36.4 |
| 2019 |
26.7 |
30.4 |
40.0 |
47.8 |
Source: Parliamentary Library historical data.
State and territory ministries
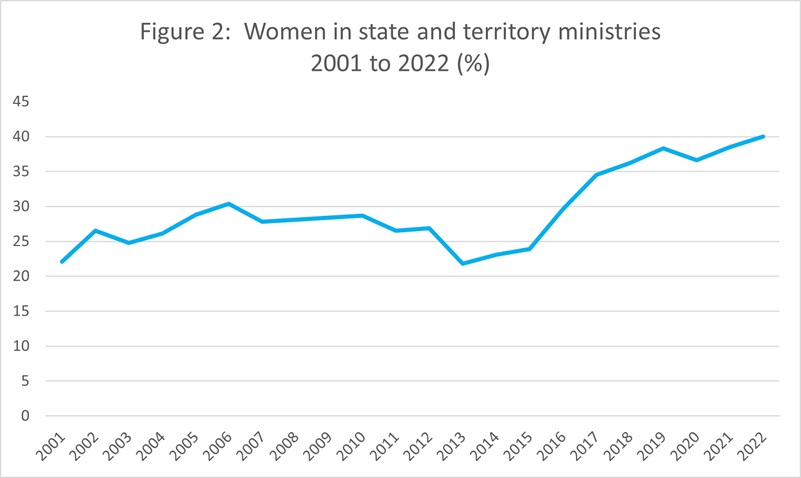
As shown in Figure 2 below, the percentage of women in state and territory ministries has risen from 22% in 2001 to 40% in 2022.

Source ABS, ‘Gender Indicators, Australia’, and Parliamentary Library data. Reference point is 1 January each year.
As set out in Table 2 below, most ministers in the Victorian, Australian Capital Territory and Northern Territory parliaments are women, as of 26 April 2022. In six of Australia’s eight states and territories, over 40% of ministers are women.
Table 2: Gender composition of state and territory ministries as of 26 April 2022
| State/Territory |
Men |
Women |
Total |
% Women |
| New South Wales |
19 |
7 |
26 |
26.9 |
| Victoria |
10 |
12 |
22 |
54.5 |
| Queensland |
10 |
8 |
18 |
44.4 |
| Western Australia |
12 |
5 |
17 |
29.4 |
| South Australia |
9 |
6 |
15 |
40.0 |
| Tasmania |
5 |
4 |
9 |
44.4 |
| Australian Capital Territory |
4 |
5 |
9 |
55.6 |
| Northern Territory |
3 |
6 |
9 |
66.7 |
Source: Parliamentary Library data based on information available on state and territory parliament websites.
Factors affecting the gender composition of ministries and Cabinets
Government leaders ultimately decide the composition of their ministries and Cabinets. However, their choices are constrained by political influences within their parties. In addition to gender composition, consideration is also given to the representation of each party (in the case of coalition governments), and of factions, as well as other types of diversity. While it has been argued that higher proportions of women in parliament will lead to stronger female representation in ministries and Cabinets, there is not always a clear correlation between the two.
Further reading
For more resources relating to women in politics, please refer to the Parliamentary Library publication ‘Women in parliament and politics: a quick guide to key internet links’.