Appendix A
Workforce statistics
Staff profile by headcount
Table 28: Ongoing and non-ongoing employees as at 30 June 2016
|
|
Ongoing
|
Non-ongoing
|
|
|
Classification
|
Full-time
|
Part-time
|
Sessional
|
Full-time
|
Part-time
|
Sessional
|
Casual
|
|
|
|
F
|
M
|
F
|
M
|
F
|
M
|
F
|
M
|
F
|
M
|
F
|
M
|
F
|
M
|
Total
|
|
PSL1
|
|
7
|
|
1
|
|
|
|
1
|
1
|
1
|
|
|
7
|
1
|
19
|
|
PSL12*
|
15
|
82
|
|
1
|
1
|
10
|
|
2
|
|
|
|
2
|
6
|
28
|
147
|
|
PSL123*
|
|
1
|
|
|
|
|
|
|
|
|
|
|
|
|
1
|
|
PSL2
|
7
|
13
|
6
|
4
|
3
|
1
|
3
|
2
|
|
|
1
|
|
6
|
11
|
57
|
|
PSL23*
|
|
14
|
|
1
|
|
|
|
|
|
|
|
|
|
|
15
|
|
PSL3
|
16
|
21
|
1
|
|
|
|
4
|
1
|
|
|
|
|
5
|
4
|
52
|
|
PSL4
|
23
|
57
|
6
|
|
1
|
1
|
4
|
2
|
|
|
|
|
3
|
5
|
102
|
|
PSL45*
|
6
|
10
|
1
|
|
|
|
1
|
1
|
1
|
|
|
|
|
|
20
|
|
PSL5
|
18
|
36
|
6
|
|
|
|
1
|
2
|
1
|
|
|
|
|
|
64
|
|
PSL56*
|
12
|
9
|
8
|
|
18
|
8
|
|
|
|
|
|
|
5
|
1
|
61
|
|
PSL6
|
34
|
70
|
5
|
2
|
|
|
8
|
1
|
1
|
|
|
|
2
|
|
123
|
|
PEL1
|
49
|
66
|
14
|
4
|
|
|
6
|
3
|
|
2
|
|
|
1
|
2
|
147
|
|
PEL2
|
13
|
29
|
3
|
|
|
|
1
|
|
1
|
1
|
|
|
|
|
48
|
|
SES1
|
4
|
10
|
|
|
|
|
|
|
|
|
|
|
|
|
14
|
|
SES2
|
1
|
|
1
|
|
|
|
|
|
|
|
|
|
|
|
2
|
|
Parliamentary Librarian
|
|
|
|
|
|
|
1
|
|
|
|
|
|
|
|
1
|
|
Secretary
|
|
|
|
|
|
|
|
1
|
|
|
|
|
|
|
1
|
|
Total
|
198
|
425
|
51
|
13
|
23
|
20
|
29
|
16
|
5
|
4
|
1
|
2
|
35
|
52
|
874
|
*Indicates a broadband position. Under the Parliamentary Service Classification Rules 2010, the Secretary may allocate more than one classification (a broadband) to a group of duties if the group of duties involves work value applying to more than one classification
Table 29: Ongoing and non-ongoing employees as at 30 June 2015
|
|
Ongoing
|
Non-ongoing
|
|
|
Full
Time
|
Part Time
|
Sessional
|
Fixed Term FT
|
Fixed Term PT
|
Fixed Task FT
|
Casual
|
Sessional
|
|
|
Classification
|
M
|
F
|
M
|
F
|
M
|
F
|
M
|
F
|
F
|
F
|
M
|
F
|
M
|
F
|
Total
|
|
APPPSL1/21
|
|
|
|
|
|
|
1
|
|
|
|
|
|
|
|
1
|
|
PSL1
|
6
|
|
|
|
|
|
|
|
1
|
|
1
|
7
|
|
|
15
|
|
PSL1/21
|
63
|
5
|
1
|
1
|
32
|
7
|
2
|
1
|
|
|
22
|
3
|
2
|
1
|
140
|
|
PSL1/2/31
|
1
|
|
|
|
|
|
|
|
|
|
|
|
|
|
1
|
|
PSL2
|
13
|
6
|
5
|
7
|
1
|
5
|
1
|
1
|
2
|
|
9
|
7
|
|
|
57
|
|
PSL2/31
|
20
|
|
|
|
|
|
1
|
|
|
|
|
|
|
|
21
|
|
PSL3
|
21
|
15
|
|
2
|
|
1
|
|
|
|
|
7
|
8
|
|
|
54
|
|
PSL4
|
58
|
23
|
1
|
5
|
1
|
1
|
1
|
1
|
|
|
6
|
3
|
|
|
100
|
|
PSL4/51
|
10
|
6
|
|
1
|
|
|
3
|
1
|
|
|
|
|
|
|
21
|
|
PSL5
|
32
|
16
|
|
5
|
|
|
5
|
3
|
|
1
|
|
|
|
|
62
|
|
PSL5/61
|
11
|
15
|
|
8
|
6
|
15
|
|
|
|
|
2
|
1
|
|
|
58
|
|
PSL5/6E1
|
|
|
|
1
|
|
|
|
|
|
|
|
|
|
|
1
|
|
PSL6
|
72
|
29
|
3
|
4
|
|
1
|
4
|
2
|
3
|
|
|
2
|
|
|
120
|
|
PEL1
|
60
|
38
|
5
|
13
|
|
|
9
|
8
|
2
|
1
|
1
|
|
|
|
137
|
|
PEL2
|
32
|
18
|
|
4
|
|
|
1
|
1
|
|
|
|
|
|
|
56
|
|
SES1
|
7
|
6
|
|
|
|
|
1
|
|
|
|
|
|
|
|
14
|
|
SES2
|
|
1
|
|
1
|
|
|
1
|
|
|
|
|
|
|
|
3
|
|
Parliamentary Librarian2
|
|
|
|
|
|
|
|
|
|
|
|
|
|
|
|
|
Secretary
|
|
|
|
|
|
|
|
1
|
|
|
|
|
|
|
1
|
|
Total
|
406
|
178
|
15
|
52
|
40
|
30
|
30
|
19
|
8
|
2
|
48
|
31
|
2
|
1
|
862
|
1Indicates a broadband position. Under the Parliamentary Service Classification Rules 2010, the Secretary may allocate more than one classification (a broadband) to a group of duties if the group of duties involves work value applying to more than one classification.
2The Parliamentary Librarian was Acting Secretary at 30 June 2015.
Remuneration
Table 30: Actual salary ranges (excluding casual rates) at 30 June 2016
|
Classification
|
Step
|
July 2013
3% *
|
|
PSL 1 DPS
|
Min
|
$47,480
|
|
|
Max
|
$55,297
|
|
PSL 2 DPS
|
Min
|
$56,404
|
|
|
Max
|
$60,552
|
|
PSL 3 DPS
|
Min
|
$61,900
|
|
|
Max
|
$64,685
|
|
PSL 4 DPS
|
Min
|
$65,978
|
|
|
Max
|
$71,693
|
|
PSL 5 DPS
|
Min
|
$73,126
|
|
|
Max
|
$78,452
|
|
PSL 6 DPS
|
Min
|
$80,020
|
|
|
Max
|
$89,937
|
|
PEL 1 DPS
|
Min
|
$97,379
|
|
|
Max
|
$111,183
|
|
PEL 2 DPS
|
Min
|
$113,405
|
|
|
Max
|
$131,833
|
|
|
Barrier
|
$134,470
|
*Note: these figures reflect minimum and maximum salary points only and excludes superannuation and other benefits.
Appendix B
Environmental Management
DPS reports annually on elements of environmental performance, in line with the Environment Protection and Biodiversity Conservation Act 1999 (EPBC Act), for the management of resources for which it is responsible.
DPS also reports under:
- the Energy Efficiency in Government Operations (EEGO) Policy
- the National Environment Protection Measures (Implementation) Act 1998, and
- the National Pollutant Inventory (NPI).
Ecologically sustainable development
The objective of Ecologically Sustainable Development (ESD) is defined as ‘development that improves the total quality of life, both now and in the future, in a way that maintains the ecological processes on which life depends’56
DPS reports annually on ESD through this report.
Identification, management and monitoring of environmental impacts
DPS aims to ensure that the vital functions of Australian Parliament House (APH) operate effectively, while minimising resource consumption and waste production by:
- monitoring environmental performance
- implementing programs and projects to improve environmental outcomes, and
- developing plans to improve environmental sustainability.
Many activities at APH—including maintenance, engineering, landscaping, ICT, catering and office-based services—have the potential to affect the environment through energy and water consumption, greenhouse gas emissions and waste generation.
DPS incorporates environmental guidelines and checklists in the procurement of products and services and in the planning and delivery of projects, including consideration of:
- whole-of-life principles
- sustainable procurement principles
- reuse and recycling of materials, and
- energy, water and waste minimisation.
Communication and promotion
DPS provides information on its environmental performance and promotes sustainability initiatives through the APH website, internal circulars and departmental newsletters. DPS encourages participation in annual environmental events such as National Recycling Week.
Environmental performance
Water consumption
Total water consumption for 2015–16 was 227,068KL, representing an increase of 21 per cent on the 187,300KL consumed the previous year. Landscape water consumption decreased from 99,269KL in 2014–15 to 93,629 KL in 2015–16, representing a decrease of 6 per cent. Annual water consumption for APH is shown in Figure 16.
Figure 16: Annual water consumption 2006–16

Overall water consumption for 2015–16 has increased compared to previous years due to higher building water consumption.
Building water consumption in 2015–16 was 133,439KL, an increase of 52 per cent on the 88,031KL consumed the previous year. The increase in building water use was due to a combination of factors including:
- additional flushing of the hot water supply system
- leaks identified in two external water ponds
- leak identified in building heating system (boiler)
- cleaning of the external building façade, and
- repairs to a faulty water utility meter (previously unmetered).
Water saving initiatives
Lake water supply initiative
The ongoing reliance on potable (high-quality drinking) water for maintaining the APH landscape is expected to be problematic for DPS in the coming years, as water utility costs increase and drier weather conditions are expected to become more frequent, resulting in higher water consumption.
A feasibility study completed in late 2014 concluded that water sourced from Lake Burley Griffin could provide a safe, reliable and cost effective water supply for landscape irrigation. Landscape irrigation at APH accounts for between 40 and 60 per cent of total water use.
A comprehensive risk assessment, which considered water availability, DPS demand, water quality, route options, financial models, as well as the possibility of delivering lake water under a shared infrastructure arrangement, was completed.
An application for a Water Access Entitlement was successfully lodged with the ACT Government, which will allow DPS to extract 115,000KL of raw water annually from Lake Burley Griffin to be treated and used to replace the current irrigation water.
Work on the detailed design and construction tender documentation of an infrastructure solution has commenced. The overarching design consideration is for a safe and reliable separation of lake water from the existing potable water system, while allowing ready access to either water source, through an appropriate switching arrangement for the purpose of irrigation activities.
Energy Consumption
In 2015–16, energy consumed at APH and by DPS vehicles was 137,315 GJ, representing a decrease of 1.3 per cent from the previous year. Electricity consumption increased by 1.5 per cent, natural gas consumption decreased by 7 per cent, diesel fuel energy (non-transport) increased by 64 per cent, and energy for DPS vehicles decreased by 20 per cent compared with 2014–15.
Table 31 shows energy consumption by the APH building and DPS vehicles.
Building energy use comprises:
- natural gas for heating, general hot water and in kitchens
- electricity to power office lighting, mechanical services, lifts, cooling and ICT equipment, and
- a small amount of diesel mainly used for testing the emergency backup generators.
Table 31: Energy consumed at Parliament House and by DPS vehicles
|
Indicator
|
Energy consumption (GJ)
|
|
|
2013–14
|
2014–15
|
2015–16
|
|
Parliament House building1
|
136,450
|
138,669
|
136,916
|
|
Transport–passenger vehicles
|
261
|
199
|
73
|
|
Other transport2
|
383
|
301
|
325
|
|
Total energy consumption
|
137,094
|
139,169
|
137,315
|
1Includes electricity, natural gas and diesel (non-transport).
2Includes LPG, diesel and petrol used for maintenance and loading dock vehicles.
Figure 17: Annual electricity and gas consumption from 2006–07 to 2015–16

Electricity, gas and diesel consumption
Figure 17 shows APH electricity and gas usage in 2015–16 was consistent with previous years. Energy use in 2015-16 was comparatively lower than 2014–15 due to the early federal election in 2016, when building occupancy and associated energy use was lower.
Transport energy use
In 2015–16, there was a 63 per cent reduction in energy use associated with DPS passenger vehicles compared with 2014–15. The reduction was due to the SES vehicle fleet being abolished during 2014–15. Other transport energy increased slightly, consisting of fuel used in DPS maintenance and loading dock vehicles, many of which operate on electric power to reduce emissions.
Energy saving initiatives
In 2015–16, completed building projects that incorporated energy efficiency include:
- upgrade of ‘uninterruptible power supply’ equipment
- upgrade of the Federation Chamber lighting, and
- upgrade of the ‘Main Production Kitchen’ equipment.
Projects incorporating energy efficiency that commenced in 2015–16 and to be completed over the coming years include:
- upgrade of office, corridor and Senate chamber lights
- upgrade of building lighting controls incorporating occupancy sensors, and
- upgrade of building heating and cooling equipment – two large chillers and three boilers.
Recycling and waste management
Parliament House waste is generated from a diverse range of activities within the building. Quantities and types of waste fluctuate throughout the year depending on building occupancy, sitting patterns, construction projects, office refurbishments, and election reshuffles.
DPS provides facilities to recycle paper, cardboard, printer cartridges, lamps, used oil, grease, batteries, landscape material, metal, organic food waste and co-mingled waste.
In 2015–16, the amount of general waste (excluding construction waste) sent to landfill was 335 tonnes. This is an increase of 12 per cent compared with the 299 tonnes sent in 2014–15. The increase in landfill waste is due to an early election in 2016 and associated office cleanouts, increased maintenance activity in the building, and a cleaner’s strike, resulting in recyclable waste sent to landfill.
In 2015–16, a total of 217 tonnes of paper was recycled—an increase of 13 per cent compared with the 192 tonnes in 2014–15. The amount of paper and cardboard recycled varies annually depending on parliamentary business and other building activity.
Construction waste is managed under project contracts and where possible and appropriate, construction materials are reused, recycled or disposed of in an environmentally friendly manner.
Figure 18: Annual waste disposed to landfill and paper recycled

The preferred method for disposing of green landscape waste at APH is to chip the material on site and re-use it in the gardens. When waste generated in the landscape cannot be chipped on site the material is taken off site to be recycled or sent to landfill. During 2015–16, 108 tonnes of landscape waste was sent for recycling. No landscape waste was sent to landfill. Figure 19 shows annual trends in landscape waste recycling rates.
Figure 19: Annual quantity of landscape waste (tonnes)

Co-mingled and organic waste recycling
Co-mingled waste includes metal cans, glass bottles, milk cartons and plastic, collected in a common bin. During 2015–16, a total of 37 tonnes of co-mingled waste was collected and recycled, a 7 per cent increase compared to the amount collected and recycled in 2014–15.
DPS collects organic food waste from catering operations in the building for recycling at a local worm farm. Since being introduced in 2012, the initiative has helped reduce the burden on ACT landfill sites and reduce emissions (methane) caused by the breakdown of food waste.
During 2015–16, a total of 55 tonnes of organic waste was diverted from landfill and converted into garden compost material using the worm farm. Figure 20 illustrates annual co-mingled and organic recycling rates.
Figure 20: Annual co-mingled and organic waste recycled (tonnes)

Emissions and effluents
Greenhouse gas emissions
During 2015–16, a total of 24,959 tonnes of carbon dioxide equivalent (CO2e) was generated from Parliament House operations, representing a 2 per cent decrease from 2014–15. In 2015–16, DPS purchased 10 per cent accredited green power through the whole-of-government electricity contract, and reduced CO2 emissions by a further 53 tonnes from clean electricity generated by roof-top solar panels at APH. Table 32 shows the breakdown of emissions within various categories.
Table 32: Parliament House emissions (direct and indirect, including passenger and operational vehicle fleets)
|
Emission category
|
Comment
|
2013–14
(tonnes CO2e)
|
2014–15
(tonnes CO2e)
|
2015–16
(tonnes CO2e)
|
|
Scope 1
|
Emissions at the source of the activity (for example, emitted from gas and fuels used at APH and by vehicles)
|
2,548
|
2,504
|
2,350
|
|
Scope 2
|
Emissions generated elsewhere (for example, by the power plants that produce the electricity used at APH)
|
19,533
|
19,374
|
19,283
|
|
Scope 3
|
Indirect emissions, meaning emissions generated during the delivery of electricity, gas and fuel to APH, over which DPS has little control
|
4,473
|
3,627
|
3,326
|
|
Scopes 1 and 2 total
|
DPS has direct responsibility for these emissions
|
22,081
|
21,878
|
21,633
|
|
Total net emissions (Scopes 1, 2 and 3)
|
Direct and indirect emissions including offsets
|
26,554
|
25,505
|
24,959
|
Figure 21: Annual greenhouse gas emissions from electricity and gas, and carbon savings from purchase of accredited green power and roof-top solar panels
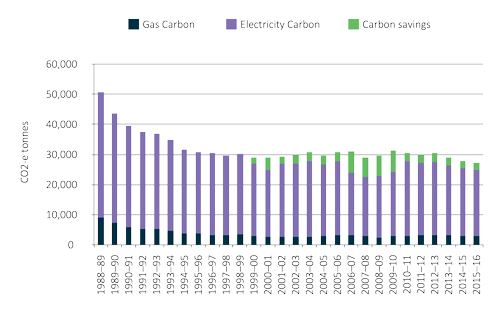
Emission reductions from recycling
In 2015–16, DPS diverted 55 tonnes of organic food waste from landfill to a local recycling facility—equivalent to reducing lifetime landfill CO2 emissions by 88 tonnes.57
Ozone-depleting substances
APH relies on refrigerants that contain ozone-depleting substances. These are used for chillers, cool rooms and refrigerators. DPS is reducing the requirement for ozone-depleting gases through timely replacement of older equipment with equipment that uses environmentally safer refrigerants.
In 2015–16, all refrigerants purchased for equipment maintenance were free of ozone-depleting substances.
Air pollutants
The combustion of natural gas at APH for heating, hot water and cooking purposes generates oxides of nitrogen (NOx), oxides of sulphur (SOx) and other air pollutants. DPS reports annually on these emissions to the National Pollution Inventory (www.npi.gov.au).
Discharges to water
Sewage from APH is required, under a trade waste agreement, to be equivalent to domestic strength (a domestic equivalent is a concentration or level the same as would be found in household waste water). To ensure these requirements are met, the following facilities are in place:
- a grease trap on each kitchen drain
- a coalescing plate filter on the vehicle wash-down bay (to prevent oil from entering the sewer), and
- a system to remove paint solids from paint brush washing facilities before they enter the sewer.
Significant spills of chemicals, oils and fuels
In 2015–16, there were no significant spills of chemicals, oils or fuels from APH.
Appendix C
Advertising and Market Research
In accordance with section 311A of the Commonwealth Electoral Act 1918, DPS annually reports expenditure on advertising and market research. Expenditure by DPS in 2015–16 was as follows:
Table 33: Advertising costs
|
Description
|
Cost (ex GST)
2015–16
|
|
|
Dentsu Mitchell
|
$29,188.97
|
|
|
Canberra Convention Bureau
|
$2,000
|
|
|
National Capital Educational Tourism Project
|
$1,250
|
|
During 2015–16, DPS did not conduct any government advertising campaigns.
Appendix D
Legal Services Expenditure
Table 34: Legal services expenditure
|
Description
|
2014–15
|
2015–16
|
|
External Legal Expenditure
|
263,407
|
257,401
|
|
Internal Legal Expenditure
|
616,523
|
934,019
|
|
Total Legal Expenditure
|
879,930
|
1,191,421
|
Appendix E
Disability Reporting
Since 1994, non-corporate Commonwealth entities have reported on their performance as policy adviser, purchaser, employer, regulator and provider under the Commonwealth Disability Strategy. In 2007–08, reporting on the employer role was transferred to the Australian Public Service Commission’s State of the Service reports and the APS Statistical Bulletin. These reports are available at www.apsc.gov.au. From 2010–11, entities have no longer been required to report on these functions.
The Commonwealth Disability Strategy has been overtaken by the National Disability Strategy 2010–2020, which sets out a 10-year national policy framework to improve the lives of people with disability, promote participation and create a more inclusive society. A high-level, two-yearly report will track progress against each of the six outcome areas of the strategy and present a picture of how people with disability are faring. The first of these progress reports was published in 2014, and can be found at www.dss.gov.au.
Appendix F
Correction of Material Errors in Previous Annual Report
Page 57
Revenue from the Parliament Shop for 2014–15 was $1,030,879.78 (excluding GST), not $1,029,859 (including GST) as reported.