Introduction
The Department of Parliamentary Services (DPS) places a high priority on our responsibilities for management of the environmental aspects of Parliament House to ensure that we have a building that is safe, and has efficient and sustainable facilities that meet the demands of a modern workplace.
DPS manages and reports on the environmental aspects for the whole of Parliament House. In some cases, this includes information from the Department of the Senate and the Department of the House of Representatives.
Overview
Parliament House provides the home for the Australian Parliament and is also a major attraction for visitors and educators. These functions mean that it is a large operation which consumes resources and produces waste. DPS aims to ensure the vital functions of Parliament House operate effectively, while minimising resource consumption and waste production, and maintaining the heritage value of the building.
There are three key activities for DPS in delivering its environmental responsibilities.
- We collect data about environmental performance.
- We develop forward plans to improve our environmental performance.
- We implement programs and projects to improve our environmental performance.
This part of the Annual Report:
- summarises our overall plans;
- summarises our ‘whole-of-Department/whole-of-Parliament’ environmental activities; and
- details our environmental performance and activities related to water usage, energy efficiency, waste production, and gaseous emissions.
Environmental reporting information in this part is structured using the core Global Reporting Initiative (GRI) environment performance indicators (www.globalreporting.org).
In reviewing environmental performance for Parliament House, there are two important realities.
Firstly, the Canberra region has just come out of a long period of sustained low rainfall. This provided considerable impetus to reduce water consumption, within the building and for landscape purposes around the building. Water conservation measures were largely successful over that period. Recent rainfalls have led to a change in the ACT Government’s water restrictions; however, DPS continues to manage the building and landscape with the knowledge that Canberra’s climate is vulnerable to low rainfalls in the future. Periods of severe water restrictions will recur.
Secondly, we had considerable success in reducing energy consumption over the first two decades of the life of the building (around 58% reduction), but our high energy systems are now over 23 years old. Some systems were replaced this financial year; but others are nearing end of life. Further improvement in energy performance is feasible; but these will require major investment in new technologies. DPS is planning strategies for upgrading our central energy systems and related heating, ventilating and airconditioning systems. Trigeneration technology appears to be very promising and will continue to be a key focus in the coming years.
DPS reports annually on elements of environmental performance in line with the Environment Protection and Biodiversity Conservation (EPBC) Act 1999 (EPBC Act). DPS also reports on behalf of the Department of the Senate and the Department of the House of Representatives.
DPS also reports under:
- the Energy Efficiency in Government Operations (EEGO) policy;
- the National Environmental Protection Measures (NEPM) Act;
- the National Pollution Inventory (NPI); and
- the National Packaging Covenant (NPC).
Ecologically sustainable development
DPS reports on how the activities of the parliamentary departments, including their administration of legislation, accorded with the principles of ecologically sustainable development (ESD). The goal of ESD is defined as ‘development that improves the total quality of life, both now and in the future, in a way that maintains the ecological processes on which life depends’.
The parliamentary departments do not manage, coordinate or administer legislation that impacts directly on ESD. However, the Departments of the Senate and the House of Representatives carry out law-making and policy-review roles at Parliament House, which have the potential to support ESD principles.
To support Senators, Members and their staff in their parliamentary duties, DPS provides information and research services. One area of expertise is the Science, Technology, Environment and Resources Section of the Research Branch in the Parliamentary Library. The Parliamentary Library’s collections provide comprehensive environmental resources. Together, these services and resources can assist Senators and Members to assess how their decisions impact on ESD.
Contributions of outcomes
DPS reports on how the outcomes specified in an Appropriations Act for the reporting period contribute to ESD.
The 2010–11 outcomes of the parliamentary departments, specified in the Appropriations Acts (Parliamentary Departments), do not directly contribute to ESD. However, subprogram 3.1 in the DPS Portfolio Budget Statement 2010–2011 sets energy and water consumption, greenhouse gas emissions and recycling targets. These outcomes require DPS to manage the potential impact of parliamentary operations on the environment.
Identification, management and monitoring of environmental impacts
DPS reports on the effects of the parliamentary departments’ activities on the environment; the measures in place to manage environmental impacts; and how DPS ensures these measures are reviewed and improved.
Activities and operations at Parliament House—particularly maintenance, engineering, landscape, computing and catering services—have the potential to affect the environment, as do office-based activities. These result in:
- consumption of electricity, natural gas, diesel fuel, water, paper and other resources;
- greenhouse gas emissions; and
- generation of waste.
Whole-of-Department/ Whole-of-Parliament initiatives
Strategic plans
A new plan that encompasses all environmental factors affecting Parliament House is being developed. This plan will replace the Energy Strategic Plan and the Water Strategic Plan that were developed in 2007, and the Waste Strategic Plan developed in 2008–09. The new plan will include strategic direction for natural resources, water and waste management, and land management in and around Parliament House. This new environmental strategic plan will provide a long-term, 20-year strategic direction and detail the shorter-term actions.
A number of objectives in the existing Water Strategic Plan have been achieved and work continued on a number of other objectives, notably to reduce internal and external water consumption. Similarly, some of the objectives of the Energy Strategic Plan objectives were achieved. However, it is apparent that major further reductions in energy consumption will require renewal of ageing plant and equipment, with a particular focus on heating, ventilating and airconditioning systems, and the central energy plant.
Sustainable purchasing practices
The DPS Chief Executive’s Procedures (CEPs) require procurement decisions to take into account the total resources required to develop, acquire, own, operate and dispose of departmental purchases. Green procurement information has been incorporated into the CEP DPS Procurement of Property (Goods) and Services.
All DPS purchases require consideration of the Department of Sustainability, Environment, Water, Population and Communities (DSEWPC) guidelines on purchasing.
All tender documents require tenderers to consider innovative energy, water and waste saving solutions. Tenderers are required to consider products that have the highest energy- and water-efficiency ratings, while ensuring value-for-money principles are met.
Communication and promotion
The environmental report located on the Parliament House website (http://www.aph.gov.au/environment) shows progress against water, energy, emissions and waste targets. Details on environmental initiatives are also published on the Parliament House website. Current initiatives include the couch grass trials and the pilot use of solar energy. A new Parliament House website is being developed and access to information on environmental activities and performance is being improved.
Information on consumption and initiatives relating to energy, water and waste is provided to the DPS Executive Committee on a monthly basis. Similar information is also provided to the Senior Management Coordination Group, which includes representation from the Chamber departments.
DPS supported National Ride to Work Day on 13 October 2010 by providing a promotional stand, maps, brochures, newsletter articles, lunchtime talks and a free breakfast.
Advice on environmental management is provided to building occupants in information circulars. Newsletter articles on topical environmental issues are included in the DPS Dispatch, our fortnightly staff newsletter.
DPS worked with Channel Ten to produce some Parliament House environmental stories, which were aired on the children’s program Totally Wild.
Environmental performance
Water
Water use is a significant environmental aspect of Parliament House operations, particularly because of our commitment to comply with ACT Government water restrictions. Water conservation has had a wide-reaching impact on the look of the Parliamentary Precincts, including how or if we carry out cleaning and maintenance activities. With some relaxation this year to the water restrictions, DPS has been able to reactivate eight water features and undertake some necessary external cleaning of the building.
Water consumption
Total water consumption for 2010–11 was 152,842kL. This was a reduction of 5.2% compared with the previous year’s consumption. Water consumption this year was the lowest on record, as shown in Figure 5.1.
The decrease was mainly due to a reduction in water use for irrigation from 83,817L in 2009–10 to 73,084L in 2010–11. This represents a 13% reduction in landscape water use and is mainly attributed to higher-than-average rainfall. 2010–11 being an election year would also have resulted in a modest reduction in internal water consumption.
Figure 5.2 shows a breakdown of water use during 2010–11. ‘Building—other cold water’ includes the cold water used in bathrooms, kitchens and the swimming pool. Boosted hot water is used for kitchen cleaning purposes. The ’flushometer’ consumption is the water used for flushing toilets and urinals.
Permanent Water Conservation Measures and Temporary Water Restrictions
On 1 November 2010, the ACT moved from Stage 2 water restrictions to Permanent Water Conservation Measures (PWCM). DPS was able to meet targets set during the restrictions period and is committed to sustainable long-term water savings under PWCM.
DPS will continue to work closely with the ACT Electricity and Water authority (ACTEW) in its efforts to develop and implement water-efficiency management plans that will deliver required water savings for large water consumers in the ACT.
Water saving initiatives
Savings in the landscape
The most significant water savings have been made in the Parliament House landscape. For the fifth year, overall irrigation was reduced, with actual watering levels based on monitoring of soil moisture levels.
Landscape Services staff use soil moisture sensors in the parliamentary landscape to ensure that irrigation only happens when the soil is dry. A weather station linked to the central irrigation system is used to manage irrigation water based on daily evaporation figures. The use of couch grass has the potential to reduce irrigation of lawns by around 50%. Following successful couch grass trials that began in January 2008, couch grass has continued to be planted in selected areas of the landscape. Nearly 20% of the lawn areas at Parliament House have been replaced using drought-tolerant couch grass, with the remaining selected areas around Parliament Drive to be completed in the coming year. This will represent 23% of the total lawn areas at Parliament House and further replacement is not planned at this stage.
Water features and the forecourt pond
In 2009–10, DPS initiated a water-recycling project to re-use discarded water from the cooling towers and convert it into high-grade water through a reverse osmosis (RO) treatment process. In 2010–11, the Forecourt pond and three water features were connected to this recycled water supply.
A new initiative currently being trialled is the use of RO recycled water for the cleaning of marble surfaces to reduce the amount of distilled water purchased.
Male Public Toilet refurbishment
A refurbishment of the male public toilets was completed in December 2010, in line with the Water Strategic Plan objective to install water-efficient appliances.
Low-flow urinals, dual-flush toilets and sensor-activated taps in basins were installed, replacing the original fittings and fixtures.
Energy
Parliament House is a major energy consumer. DPS is committed to reducing energy consumption and has progressed various projects to deliver a significant reduction.
In 2010–11, energy improvement projects that were completed or progressed include:
- installation of a solar electricity pilot;
- installation of energy-efficient lights for car parks;
- installation of new energy-efficient chillers;
- server consolidation—a reduction in IT equipment;
- installation of efficient cooling for the main server room; and
- decommissioning of central waste system.
Other energy-efficiency projects that are planned include:
- upgrade of internal office lighting;
- catering equipment refurbishment; and
- upgrade of energy metering.
Some of these projects are further discussed in the energy-saving initiatives section of this report.
Energy consumption
The DPS energy profile consists of energy consumed at Parliament House and transport energy, including passenger vehicles and maintenance vehicles (‘other transport’) operated by the three parliamentary departments. Figure 5.3 summarises this energy use in 2010–11.
Energy consumed in 2010–11 was 141,665GJ, a decrease of 1% on the 143,134GJ consumed the previous year. Combined passenger and other transport energy use decreased by 13 per cent compared to the previous year.
Electricity and natural gas consumption at Parliament House comprised 98%— 139,273GJ—of total energy use. Gas is used for heating, domestic hot water and in kitchens. Electricity powers a variety of services including office lighting, mechanical services, lifts, chillers, computer equipment and boosted hot water heating.
The federal election in August 2010 meant fewer sitting days in 2010–11, resulting in slightly reduced energy consumption compared to the previous year. Natural gas consumption increased due to significantly lower autumn temperatures in 2011.
Figure 4 shows the trend in energy (electricity and gas) consumption since the building was opened. Although significant reductions have been achieved, analysis shows a small upward trend in recent years. This can be attributed to extra accommodation requirements, ageing equipment and operational demands.
To improve analysis of energy usage, DPS is upgrading the energy metering system at Parliament House. This will provide a better understanding of how and where energy is used throughout the building.
Vehicles
Parliament House’s passenger vehicle fleetconsisted of 36 leased vehicles in 2010–11. Nineteen vehicles scored higher than 10 in the Green Vehicle Guide.
Energy-saving initiatives
Initiatives to conserve energy—including implementing more energy-efficient lighting schemes; upgrading the large building chillers used for the airconditioning; and server consolidation to reduce IT server equipment—have been or are being implemented as set out below. In addition, installation of a small number of solar panels was completed as part of a pilot for solar electric and hot water generation, and options are being considered for a new trigeneration system.
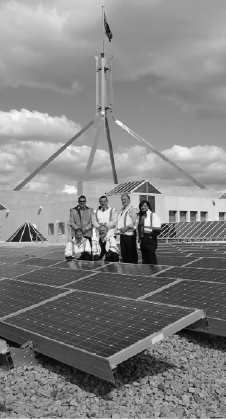
Solar Panels—Rooftop Pilot
Solar panels, with a maximum capacity of 43kW, have been installed on roofs of part of the Senate wing and the gardeners compound to test integration with building systems.
Early indications are that the solar panels are operating as expected. The solar panels produced approximately 600 kilowatt hours of electricity over the first five days of operation in 2010–11.
An assessment of the success of the project will be carried out during the next year, with results advised to building occupants.
Case study—Solar panels rooftop pilot
The solar panels rooftop pilot project was one of the key achievements for the Engineering Stream within DPS Projects Branch in 2010–11.
Solar panels were identified in the DPS energy plan 2007–10 as a potential alternative energy source.
An open tender process was undertaken for design and installation. The end result is 42 panels on the roof of the gardeners compound, and just under 200 panels on the roof of the outer Senate wing.
Each of these panels was designed and manufactured in Australia and has a 25-year performance warranty. Like the rest of the materials used, a heavy crane lifted the panels onto the roof. This work was done out of regular business hours.
An additional challenge for the project team was the arduous task of removing significant quantities of aggregate (small white stones), which were an original design feature of the roof. The aggregate weighs down and protects the waterproof membrane on the roof of Parliament House and also reflects heat from the building. The aggregate had to be first moved by hand to clear space for the panels to be erected and then replaced on completion.
Since the solar panels came into operation, they have provided a power output of 43kW, which is the approximate equivalent of the lighting demand from the Senate Chamber. All of the power produced by the panels is used in Parliament House.
The solar panels project has harmoniously integrated with the Parliament House design principles. The panels are a discreet feature of the roof and are not visible from ground level.
|
Base load chillers
As part of the plan to replace critical pieces of infrastructure, a project to replace of the most heavily used chillers commenced in 2009–10.
Chillers that supply base load cooling to the building will be replaced with new chillers that are capable of operating at much greater levels of efficiency.
During 2010–11, two heavily used chillers were replaced.
Lighting
During 2010–11, a project to replace lighting in the car parks was completed. The new lighting scheme and lamp types will use substantially less energy than the existing scheme.
In 2010–11, low-energy light-emitting diode (LED) lamps were installed in general circulation areas throughout the building, replacing inefficient halogen (incandescent) lights in general circulation areas throughout the building. DPS is steadily reducing the number of incandescent lights in use, with the aim of phasing out all incandescent globes in 2011–12.
Server Consolidation
Power consumed by computer equipment has a significant impact on energy consumption at Parliament House.
To improve IT efficiency and assist in reducing power consumption, a ‘server consolidation’ project was completed during 2010–11 in the Basement Computer Room (BCR).
Server consolidation reduces the number of power-consuming servers that are required, while still providing the same service.
The number of servers in the BCR has been reduced by over 200 in the server consolidation project, and further reductions are planned.
Trigeneration Installation
A feasibility study and preliminary design for a trigeneration plant for Parliament House was completed in 2010.
A trigeneration plant would use natural gas to generate electricity on site. The waste heat would also be used to provide hot water and for cooling systems. Major reductions in greenhouse gas production would result. Options to install a trigeneration system are being investigated.
Earth Hour
Parliament House again participated in Earth Hour, which was held on 26 March 2011. All external lights were switched off except for those lights required for safety and security purposes—for example, lights on the flagpole.
Sustainable Transport
Most transport-related energy consumption is associated with private commuter vehicles, and taxi travel to and from Parliament House.
Options to improve public transport to Parliament House have been discussed with ACTION Buses and initiatives to improve cycling to work for building occupants have been discussed at an Environmental Management Committee (EMC) cycling subgroup.
Recycling and waste management
Waste generation and recycling
The amount of general waste (excluding construction waste) sent to landfill in 2010–11 was 340 tonnes. This is a decrease of 12% compared to the 389 tonnes sent in 2009–10. The quantity of paper recycled increased by 14% from 275 tonnes in 2009–10 to 315 tonnes in 2010–11. Figure 5.5 shows trends since 1998.
During 2009–10, DPS introduced a stationery recycling webpage to enable staff to provide information on any excess stationery they had, so other staff who order stationery could check availability in the department before proceeding with new orders.
Landscape waste
The preferred method for disposing of green waste at Parliament House is to chip the material on site and re-use it in the landscape.
The amount of chipped material is not recorded. When waste generated in the landscape cannot be chipped on site—for example, due to volume or composition—then the material is taken off site to be recycled or sent to landfill.
During 2010–11, 411 tonnes of landscape waste was sent for recycling by various private companies. All of this waste that was not chipped was sent for recycling by various private companies.
Figure 6 shows annual trends in landscape waste and recycling rates. The peak in landscape waste 2005–06 was because of waste generated by turf replacement projects on the grass ramps.
Waste management initiatives
Recycling facilities and co-mingled recycling
DPS provides facilities to recycle paper, cardboard, printer cartridges, lamps, used oil, grease, batteries, landscape, metal, polystyrene, and co-mingled waste (co-mingled wastes include metal cans, glass bottles, milk cartons and plastic, which are collected in a common bin).
Over 2010–11, 126 tonnesof co-mingled waste was collected and recycled, compared to 106 tonnes the previous year, an increase of 18% in recycling.
A towable bin system used to transport waste more efficiently between areas of the basement and the loading dock was introduced in 2010. The system provides improved identification of waste streams using different coloured towable bins. The system has also reduced the vehicle traffic in the basement as more bins can be transported at once.
Emissions and effluents
Greenhouse gas emissions
During 2010–11, 27,980 tonnes of carbon dioxide equivalent(CO2e) were generated from energy consumption at Parliament House. DPS purchased 10% of electricity from renewable sources through the whole-of-government energy contract to assist in reducing emissions. A small reduction in greenhouse emissions was achieved from the solar pilot project. Emissions were reduced by 550 kg/CO2e from the project in 2010–11. Greenhouse emissions are described in Figure 5.6.
Figure 5.8 shows annual greenhouse gas emissions since Parliament House opened in 1988.
Ozone-depleting substances
Parliament House uses refrigerants that contain ozone-depleting substances. These are used for:
- chillers, which provide cooling for the building’s airconditioning;
- cool rooms;
- freezers; and
- refrigerators.
Figure 5.9 shows the type and ‘ozone-depletion potential’ of refrigerants purchased in 2010–11.
Air pollutants—NOx, SOx and particulates
The combustion of natural gas for heating, hot water and cooking purposes generates oxides of nitrogen (NOx), oxides of sulphur (SOx) and other air pollutants. Each year, DPS reports on these emissions to the National Pollution Inventory. (www.npi.gov.au). Figure 10—Emissions of air pollutants from natural gas consumption—lists these emissions for 2010–11. Parliament House gas combustion increased by 5% in 2010–11 and, as a result, the majority of air pollution emissions increased in proportion.
Discharges to water
Sewage from Parliament House is required, under a trade waste agreement, to be equivalent to domestic strength. To ensure these requirements are met, there are:
- a grease trap on each kitchen drain;
- a coalescing plate filter on the vehicle wash-down bay (to prevent oil from entering the sewer); and
- a system to remove paint solids from paint brush washing facilities before they enter the sewer.
Significant spills of chemicals, oils, and fuels
In 2010–11, there were no significant spills of chemicals, oils or fuels from Parliament House.
Summary
Achieving sustainable environmental outcomes for Parliament House continues to be a priority for DPS.
Water use in 2010–11 was the lowest recorded water consumption at Parliament House for the second consecutive year. Improvement in waste performance saw a reduction in waste to landfill and increased recycling rates. In 2010–11, there was also the implementation of a number of initiatives to reduce our energy consumption that accord with our long-term commitment to environmental considerations. Initial results of the solar electric pilot are encouraging; with further energy-reduction initiatives being implemented in the coming year to replace ageing lighting and airconditioning equipment.