This brief provides some background data
on domestic and international economies. It includes summaries of recent
economic data, their underlying drivers, and discussion of the key issues and
concerns arising from interpretation of these data. The information in this
brief is designed to accompany the brief on the Pre-Budget Fiscal Outlook which
examines the domestic fiscal policy background and decisions.
Executive summary
- Most domestic indicators suggest the Australian economy is
growing less quickly:
- latest
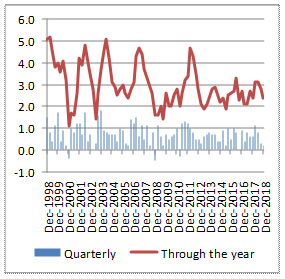
National Accounts data show GDP growth of 2.3 per cent in the year to December
2018
- Consumer
Price Inflation was 1.5 per cent in the year to December 2018 (below the RBA
‘inflation target’ of 2-3 per cent, on average, over the medium term)
- wages
growth remains sluggish at 2.3 per cent through the year despite falling
unemployment
- although
total new capital expenditure was up 1.9 per cent through the year, dwelling
investment is expected to decline (dwelling approvals fell 28.6 per cent
through the year to January 2019)
- residential
property prices are falling, particularly in Sydney and Melbourne
- consumers
are ‘cautiously pessimistic’
- business
conditions and confidence have fallen
- the
monetary policy outlook is more ‘evenly balanced’ between a cash rate rise and
a cash rate cut
- Other domestic indicators offer a more positive outlook:
- unemployment
remains low and is expected to decline further
- the
terms of trade continue to grow (by 6.0 per cent through the year)
- commodity
prices (particularly iron ore, LNG and alumina) are strong
- Concerns about global growth have increased in recent months
prompting downward revisions:
- recent
financial market turbulence
- high
trade tensions between the US and China (and between the US and the Eurozone
for auto industries) affecting trade and investment intentions
- weaker
domestic demand, incremental policy easing and a decreasing current account
surplus in China
- rising
uncertainty, including around Brexit, social unrest in France, concerns about
Italy, political risks, protectionism
- falling
consumer confidence
- shifting
monetary policy rate expectations including inflation-induced policy tightening
(particularly in the US)
-
Some positive signs in global indicators:
- trade
war fears are dissipating
- a
delay in Federal Reserve tightening
- strengthening
emerging market economies
- falling
oil prices
Domestic outlook
This section provides data and commentary on key variables
which summarise the current and expected short term future state of the
Australian macro-economy. A review of key macroeconomic indicators is followed
by discussion of current areas of concern.
Table 1: Key macroeconomic indicators for Australia
| Gross Domestic Product
(GDP) growth (volume
measures, seasonally adjusted)[1] |
|
Source: ABS
|
GDP grew by 0.2 per cent in
the December quarter 2018 (2.3 per cent through the year), following a 0.3
per cent rise in the September quarter.
Compensation of employees
grew 0.9 per cent in the quarter (4.3 per cent through the year).
Quarterly household
consumption grew by 0.4 per cent in the quarter (2.0 per cent through the
year). The household savings ratio rose to 2.5 per cent.
Government final
consumption expenditure grew 1.8 per cent in the quarter (5.6 per cent
through the year) contributing 0.3 percentage points to GDP growth. This was
largely attributed to spending on disability, health and aged care services.
Private investment fell by
1.3 per cent in the quarter, driven by dwellings and ownership transfer
costs.
Net exports detracted 0.2
percentage points from GDP growth driven by a fall in exports.
Inventories held by
business increased by $685 million in the quarter.
The RBA’s central scenario
expects output growth of 3 per cent in 2019.[2]
Oxford Economics forecasts GDP growth of 2.2 per cent in 2019 and 2.7 per
cent in 2020.[3]
|
| Consumer Price Index (CPI) and Wage Price Index
(WPI) (percentage change from
corresponding quarter of previous year, all industries, seasonally adjusted)[4] |
|
Source: ABS
|
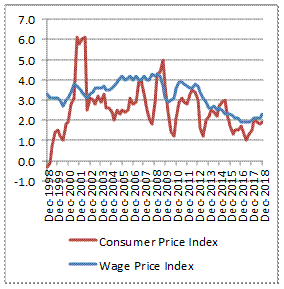
The CPI increased by 0.5
per cent in the December quarter 2018 (following a 0.4 per cent rise in the
September quarter), leading to a 1.8 per cent rise through the year.
The RBA expects
underlying inflation to ‘pick up over the next couple of years, with the
pick-up likely to be gradual and to take a little longer than earlier
expected. The central scenario is for underlying inflation to be
2 per cent this year and 2¼ per cent in 2020.’[5] Oxford Economics expect
the CPI to reach 2.5 per cent in 2020 and 2.7 per cent in 2021.[6]
In the December 2018
quarter, the all-sectors Wage Price Index rose by 0.5 per cent (the private
and public sector WPIs both rose by 0.6 per cent). Throughout the year, all
sectors rose 2.3 per cent.
(In original terms, rises
through the year ranged from 1.6 per cent for WA to 2.7 per cent for
Victoria.)
The RBA notes that ‘[t]he improvement in the labour market
should see some further lift in wages growth over time, although this is
still expected to be a gradual process.’[7]
Oxford Economics are forecasting wage growth of 3.1 per cent in 2020 and 3.6
per cent in 2021.[8]
|
| Private
capital expenditure (chain volume
measure, seasonally adjusted)[9] |
|
Source: ABS |
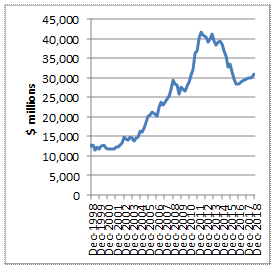
Total new capital
expenditure rose by 2.0 per cent in the December quarter 2018, up 1.9 per
cent through the year.
Buildings and structures
capital investment grew 3.2 per cent in the quarter (down 2.9 per cent
through the year); equipment, plant and machinery rose 0.7 per cent (up 8.1
per cent through the year).
Oxford Economics expect
business investment to rise by 2.2 per cent in 2019, but residential
construction will be a drag over the next couple of years.[10]
Dwelling investment is
expected to decline with falling pre-sales and tightening financial
conditions (dwelling approvals fell 28.6 per cent through the year to January
2019);[11]
business investment is expected to support growth; public investment is
supported by a large pipeline of infrastructure projects.[12]
|
| Terms
of trade (seasonally adjusted)
and commodity prices[13] |
|
Source: ABS and RBA |
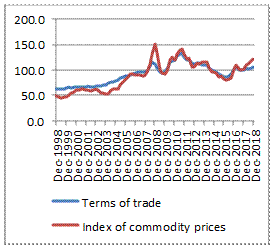
The terms of trade grew by
3.1 per cent in the December 2018 quarter (by 6.0 per cent through the year).
The RBA notes that ‘[t]he terms of trade have increased over the
past couple of years, but are expected to decline over time’[14] as Chinese demand for
bulk commodities declines and other low-cost supply enters the market.[15]
In Australian dollar terms,
the Index of Commodity Prices increased by 4.6 per cent in February. The
Index has increased by 15.4 per cent through the year (led by higher LNG,
iron ore and alumina prices).[16] |
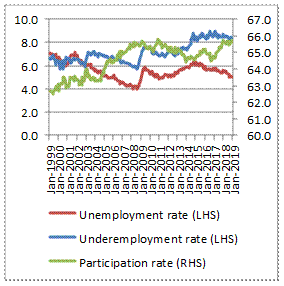
| Unemployment, underemployment and participation (per cent, seasonally adjusted)[17] |
|
Source: ABS
|
In January 2019, the
unemployment rate remained at
5.0 per cent; the participation rate increased by 0.1 percentage points to
65.7 per cent; the underemployment rate decreased 0.2 percentage points to
8.1 per cent.
Relative to January
2018, the unemployment rate fell 0.5 percentage points, the participation
rate is unchanged and the underemployment rate fell 0.6 percentage points.
The RBA expects a
‘further decline in the unemployment rate to 4¾ per cent ... over the
next couple of years’.[18]
Oxford Economics are forecasting unemployment of 5.0 per cent for 2020 and
4.9 per cent for 2021.[19] |
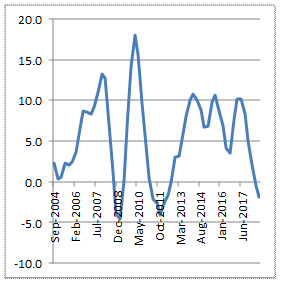
| Housing prices (year-ended growth, seasonally adjusted)[20] |
|
Source: ABS |
The Residential Property
Price Index (RPPI) for the weighted average of the eight capital cities fell
1.5 per cent in the September quarter 2018 (1.9 per cent through the year).
Melbourne property prices fell 2.6 per cent over the quarter; Sydney prices
fell 1.9 per cent.
‘Falls in Sydney and
Melbourne are no longer confined to the more expensive properties, with
declines now being observed in the middle and lower segments of the market.
Factors including tightening credit availability and falling property prices
are weighing on activity from both investors and owner occupiers.’[21]
RBA research suggests that
low interest rates explain much of the rapid growth in housing prices and
construction over the past few years.[22]
|
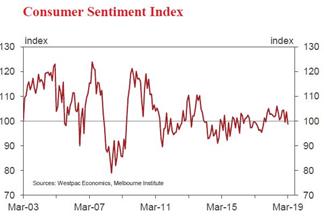
| The Westpac-Melbourne Institute Index of Consumer
Sentiment[23] |
Source: Westpac-Melbourne Institute |
The Consumer Sentiment Index
fell 4.8 per cent to 98.8 in March: consumers are ‘cautiously pessimistic’
(but still above the average level in 2017).
The deterioration was
largely attributed to the weak December quarter national accounts update and
housing market downturn.
Job loss concerns rose
sharply in March.
The Index of House
Price Expectations fell a further 2.7 per cent to 85.4 (a new low since
2009). Weakness remains pronounced in NSW and Victoria. |
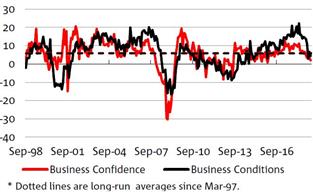
| NAB Monthly Business Survey[24] |
Source: NAB |
‘Conditions and
confidence fall – now both below average.’
The fall in business
conditions continues a relatively sharp decline over the previous six months;
although still positive, business confidence fell (and has been below average
since August 2018).
Retail remains the
weakest industry by a significant margin.
Conditions in trend
terms remain most favourable in the eastern mainland states. Capacity
utilisation (a measure of productive efficiency) is now below average;
overall survey measures of prices and inflation remain weak.
Small and Medium
Enterprise (SME) business conditions continued to decline in Q4 2018.
Confidence also declined and is now below average. Leading indicators
weakened further in Q4.[25] |
Monetary policy outlook ‘more evenly balanced’
In its latest Statement
on Monetary Policy (SMP), the RBA revised down its growth forecasts ‘in
light of recent data, particularly for consumption. GDP growth is expected to
be around 3 per cent over this year and 2¾ per cent over 2020.’[26] Forecasts for
underlying inflation were also revised ‘slightly lower’ reflecting
lower growth and ‘expected near-term weakness in administered and utilities
price inflation’.[27]
In a National
Press Club address in February, the Governor noted that, ‘[f]or some years,
growth in nominal aggregate household income has been unusually slow, averaging
just 2¾ per cent since 2016.’[28]
As a result, aggregate consumption has grown faster than income. The RBA
expects a pick-up in household disposable income to help offset the effects of
lower housing prices.
The RBA Governor says the chance of an interest rate cut is
now ‘more evenly balanced’ with the prospect of an increase:
If Australians are finding jobs and their wages
are rising more quickly, it is reasonable to expect that inflation will rise
and that it will be appropriate to lift the cash rate at some point. ... In the
event of a sustained increased in the unemployment rate and a lack of further
progress towards the inflation objective, lower interest rates might be
appropriate at some point.[29]
More recently, he has argued:
There are plausible scenarios under which the
next move in interest rates is up. There are also plausible scenarios under
which it is down. At the moment, the probabilities appear reasonably evenly
balanced.[30]
Some commentators have argued that ‘rising
funding pressures and deteriorating economic conditions will force the RBA to
slash cash rates’.[31]
ANZ has abandoned its previous prediction of two official interest rate
increases next year.[32]
In a move to increase transparency, the RBA
has begun to publish additional details on forecasts of key macroeconomic variables as at
the November 2018 Statement on Monetary Policy.[33] Comparing these numbers
with those in the December 2018 Mid-Year Economic and Fiscal Outlook
(MYEFO) shows that the RBA was more optimistic than the Government about future
GDP, consumption, exports and employment, but considerably less optimistic
about forecast growth rates for dwelling and business investment, imports and
the terms of trade.[34]
Governor Lowe has identified the following as areas to focus
on in 2019:
- a slowing in global growth with the Governor expressing ‘surprise
at some of the reaction to the lowering of forecasts for global growth, which
has been quite negative’
- the accumulation of downside risks including trade tensions
between the US and China, Brexit, the rise of populism, and ‘reduced
support from the United States for the liberal order that has supported the
international system and contributed to a broad-based rise in living standards’
-
the outlook for domestic household spending, which is closely
linked to the ‘correction’ in the housing market and the prospects for growth
in household income (in turn linked to employment and higher wages growth).[35]
In a speech on Climate
Change and the Economy by Deputy Governor Guy Debelle, he noted that ‘the
current drought has already reduced farm output by around 6 per cent and total
GDP by about 0.15 per cent’.[36]
He noted that the policy environment has a key effect, as well as the climatic
environment, on the changed environment that the economy will need to adapt to.
‘Both the impact of the [climate] shocks and the adjustment to those shocks
affect the macroeconomic trajectory.’[37]
Low wage growth
Continuing low wage growth has been a concern of
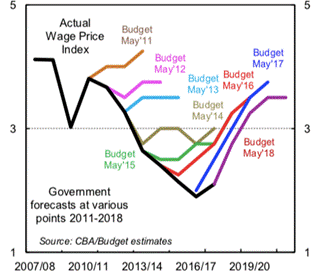
policymakers and the RBA for some time. The chart below (prepared by the
Commonwealth Bank) illustrates how wage growth has fallen, rather than
increased as forecast, in nearly every budget this decade.
The latest increase in the Wage Price Index, up 2.3 per cent
over the year in the December 2018 quarter, has been attributed to (i) a 3.5
per cent increase in the minimum wage for award-reliant workers and (ii) an
apparent acceleration of wage settlements in the (more highly unionised) public
sector.[38]
Figure 1: Budget forecasts versus reality,
wage growth 2007 to 2020
One recent study, The Wages
Crisis in Australia, identifies several potential
causes for the slowdown in wage growth:
- the decoupling of wage growth and labour productivity (due to
technological change, globalisation)
-
the increasing importance of the financial sector
- the weakening of workers’ collective bargaining rights and drop
in collective bargaining coverage and
-
increasing female participation combined with gender pay inequity
- public sector austerity policies (including downsizing, caps on
public sector wage growth)
- contracting out of social and community care services and
- increasing use of outsourcing and casual workers.[39]
The RBA Governor has cites both structural and cyclical
causes for lower wage growth:
- a downward revision of the ‘full employment’ level of
unemployment
- increasing underemployment (some part-time workers would like
more hours)
- higher levels of workforce participation
- changes in the bargaining power of workers and
- a focus on cost control in an environment of uneven diffusion of
technological progress.[40]
Falling house prices
According to the widely quoted CoreLogic Hedonic Home Value
Index, home prices fell 4.8 per cent in 2018.[41]
Housing values in in Sydney and Melbourne are predicted to fall 18‑20 per
cent from peak to trough in 2019.[42]
The RBA notes that the ‘current
correction in the housing market is a significant area of uncertainty’ with implications for the broader economy depending on how households
respond.[43] ‘Our economy is going through an adjustment
following the turn in the housing markets in our largest cities.’[44] The RBA Governor
noted that:
... unlike most other housing price corrections, this one has
not been associated with rising unemployment or higher interest rates. Instead,
mainly structural factors – relating to the underlying balance of supply and
demand – in our largest cities have been at work. The question is: what effect
will this change have on household spending?
... what we are seeing looks to be a manageable adjustment in
the housing market. It is not expected to derail economic growth.[45]
The Governor points to a number of factors as justification
for this argument:
- recent house price declines follow very large increases
- most households do not change their consumption in response to
short-term changes in their wealth, but take a longer-term perspective
- household income growth is expected to pick up (albeit gradually)
and ‘income growth usually matters more for consumption than changes in
wealth’.
However, he concludes:
Even so, given the uncertainties, we are paying very close
attention to how things evolve.[46]
Economic policy uncertainty
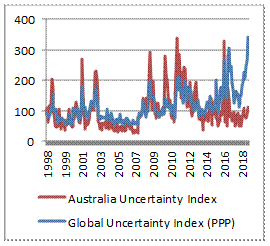
A team of US academics have devised a monthly index for Economic Policy Uncertainty.
The index for Australia is shown in Figure 2, along with a measure of global
uncertainty (a GDP-weighted average of national indices for 20 countries).[47] Although
uncertainty has increased slightly in Australia over recent months, it is well
below global values.
Another measure of economic risk gives Australia a score of 2.5 (low),
ranking it 5 out of 164 countries.[48]
Risk is unchanged from six months ago with downside risks related to: a
correction in the domestic housing market affecting residential construction
and consumer spending; China’s shift to slower, more balanced growth; and a
potential reversal of the recovery in commodity prices.
Figure 2: Economic policy uncertainty
Source: Economic
Policy Uncertainty.
International outlook
Table 2 summarises real GDP growth and inflation (CPI) data
and forecasts for 2017 to 2021 for selected international economies, focusing
on Australia’s top two-way trading partners in 2016‑17: China (23.8 per
cent of total), Japan (9.3 per cent), United States (9.0 per cent), Republic of
Korea (5.3 per cent) and the UK (3.7 per cent).[49]
Key drivers and risks for each economy are also identified.
Table 2: Real GDP growth and inflation in selected
international economies
| |
2017 |
2018 |
2019 |
2020 |
2021 |
| World |
| GDP
growth |
3.0 |
3.0 |
2.5 |
2.7 |
2.8 |
| Inflation
(CPI) |
3.0 |
3.2 |
3.1 |
3.2 |
3.1 |
| Drivers: consumer
confidence higher than two to three years ago (US and Japan), strong labour
markets (particularly in the US), lower oil prices, rising borrowing costs
may curb investment |
| Risks: escalation of
US-China trade war, no-deal Brexit, weak and volatile financial markets,
investment indicators weakening |
| Australia |
| GDP
growth |
2.4 |
2.8 |
2.2 |
2.7 |
3.0 |
| Inflation
(CPI) |
1.9 |
1.9 |
1.6 |
2.0 |
2.3 |
| Drivers: growth driven
by exports (LNG and services) and business investment, low interest rates |
| Risks: fall in
commodity prices, correction in domestic housing market, high household debt,
dependence on China, increasing trade policy tensions, slowing in capital
spending (government investment reaching a peak with end of NBN rollout),
weak consumer spending resulting from slow income growth |
| China |
| GDP
growth |
6.8 |
6.6 |
6.2 |
5.9 |
5.4 |
| Inflation
(CPI) |
1.5 |
2.1 |
2.0 |
2.3 |
2.6 |
| Drivers: expect
government stimulus measures, modest improvement in household consumption,
US-China trade war truce, easing financial and monetary policy |
| Risks: uncertainty
about trade conflict (fragile truce), slowing export growth, slowing
investment, weaker domestic demand, continuing focus on growth may compromise
reform program |
| Japan |
| GDP
growth |
1.9 |
0.8 |
0.7 |
0.3 |
1.0 |
| Inflation
(CPI) |
0.5 |
1.0 |
0.9 |
1.2 |
0.7 |
| Drivers: tight labour
market boosting consumption, government stimulus measures to soften impact of
tax rise, investment plans for large enterprises above long term averages,
investment boost from 2020 Tokyo Olympics, ‘no fiscal consolidation without
economic revitalization’, low interest rates |
| Risks: 2018 growth
affected by weather, weak export growth with slowing global trade,
consumption tax hike in Q4 2019, equity volatility, declining working-age
population, low productivity growth |
| |
2017 |
2018 |
2019 |
2020 |
2021 |
| United States |
| GDP
growth |
2.2 |
2.9 |
2.3 |
1.8 |
1.8 |
| Inflation
(CPI) |
2.1 |
2.4 |
1.6 |
2.0 |
2.0 |
| Drivers: strong labour
market fundamentals, rising earnings, strong consumer spending and
confidence, resilient business activity, firming government outlays |
| Risks: trade conflict
with China, government shutdown, ongoing political uncertainty, increasing
federal deficit, negotiations on debt limit ceiling, struggling housing
activity, tightening financial conditions |
| Republic of Korea |
| GDP
growth |
3.1 |
2.7 |
2.3 |
2.4 |
2.6 |
| Inflation
(CPI) |
1.9 |
1.5 |
1.2 |
2.1 |
2.1 |
| Drivers: pick up in
employment, front-loading of 2019 fiscal spending is expected to boost
employment and investment in eight key innovative sectors, relatively fast
pace of real labour earnings growth, subdued inflation, accommodative
monetary policy |
| Risks: slowing Chinese
and global demand (for semiconductors and petrochemicals) affecting exports,
weaker domestic demand, large rise in minimum wage, falling consumer
confidence, high household debt |
| United Kingdom |
| GDP
growth |
1.8 |
1.4 |
1.4 |
2.0 |
2.1 |
| Inflation
(CPI) |
2.7 |
2.5 |
1.9 |
1.7 |
1.6 |
| Drivers: low inflation,
looser fiscal policy, recovery in household spending |
| Risks: ‘disorderly’
Brexit plus sterling depreciation (and poor productivity performance), protectionist
trade policies slowing export growth, further cut in credit rating if public
finance improvement stalls |
| India |
| GDP
growth |
6.6 |
7.3 |
7.1 |
7.0 |
6.9 |
| Inflation
(CPI) |
3.3 |
3.9 |
4.2 |
5.4 |
5.4 |
| Drivers: lower oil
prices, more accommodative monetary conditions likely (new governor of RBI),
smaller drag from net exports, reduced impact of demonetisation in November
2016 (estimated cost 1.5 per cent of GDP) and GST imposition (came into
effect July 2017), Moody upgraded credit rating in 2017, unit labour costs
among lowest in BRIC economies |
| Risks: reduced lending
ability of non-banking financial sector may affect overall credit
availability and delay business investment plans, slowdown in private
consumption, reform momentum (on land, labour, power and education) likely to
slow as 2019 elections approach |
| Eurozone |
| GDP
growth |
2.5 |
1.8 |
1.3 |
1.5 |
1.4 |
| Inflation
(CPI) |
1.5 |
1.8 |
1.3 |
1.5 |
1.6 |
| Drivers: exports more
resilient than expected in Q4 2018, ECB dovish, strong growth in output, confidence
and private consumption in Spain, continuing growth in employment, easing
inflation |
| Risks: sharp slowdown
in Germany, fall in manufacturing activity, weak services activity, weakness
in forward-looking indicators, political risks, tensions in financial markets,
weaker world trade (especially China), threat of US tariffs on European cars,
political uncertainty and falling sentiment in Italy |
Source: Oxford Economics, Global Data Workstation, accessed 13
March 2019.
Global growth outlook
Concerns about global growth have increased in recent
months, largely attributable to:
- recent financial market moves
-
trade tensions between the US and China
-
uncertainty surrounding Brexit
- the degree to which Chinese policymakers can fine-tune growth to
prevent further economic weakness
- soft growth in the Eurozone, especially Germany and Italy and
-
inflation-induced policy tightening and the phasing out of
unconventional monetary policies which could trigger unintended liquidity
shocks.
The January update of the IMF World
Economic Outlook revised down estimates of global growth to 3.5 per
cent in 2019 and 3.6 per cent in 2020 (0.2 and 0.1 percentage points below
October projections).[50]
This was attributed to ‘softer momentum’ in the second half of 2018
(particularly in Germany, Italy and France), weakening financial market
sentiment and a deep contraction in Turkey. Potential triggers for
deteriorating risk include escalating trade tensions, a no-deal Brexit and a
‘greater-than-envisaged’ slowdown in China.
Across all economies, measures to boost potential output
growth, enhance inclusiveness, and strengthen fiscal and financial buffers in
an environment of high debt burdens and tighter financial conditions are
imperatives.[51]
The Organisation for Economic Cooperation and
Development OECD Interim Economic Outlook notes that
global growth is weakening as ‘some risks materialise’.[52] These risks include
vulnerabilities in China, Europe and financial markets. Real world GDP growth
estimates have been revised down (since November 2018) to 3.3 per cent in 2019
and 3.4 per cent in 2020. A decline of 2 per cent in domestic demand growth in
China for two years is estimated to reduce world GDP growth by more than 0.5
per cent. Euro area growth could be hit by a weak UK economy as the uncertainty
around Brexit continues.
However, RBA Governor Philip Lowe has stated
that ‘... while some of the downside risks have increased, the central scenario
for the world economy still looks to be supportive of growth in Australia’.[53]
These risks include trade tensions between the
US and China, Brexit, the rise of populism, reduced support from the US for
long-standing international agreements, and adjustments in China as the
authorities aim to reduce shadow financing. If economic activity in
China responds ‘less vigorously’ to recent fiscal and monetary policy measures,
Chinese growth could be weaker than forecast.
An advanced economy monthly growth indicator—which summarises
information from high-frequency data—fell in January, recording its sharpest monthly
drop in seven months.[54]
The leading indicator is a GDP-weighted average of 5-7 activity indicators for
20 advanced economies. The results suggest there is ‘little sign yet of a
rebound in growth momentum’. In levels terms, the index remained above the 2016
low point, suggesting a gradual loss of momentum in early 2019.
Financial market turbulence
In its latest Quarterly Review,
the Bank for International Settlements (BIS) attributed recent financial
market turbulence to ‘a reminder of the narrow path that central banks are
treading in their quest for policy normalisation, in a generally challenging
policy environment.’[55]
[U]ncertainty that surrounds the unprecedented
monetary policy normalisation process no doubt makes markets more sensitive to
such developments.[56]
In December 2018, BIS concluded that:
... the market tensions we saw during this
quarter were not an isolated event. As already noted on previous occasions,
they represent just another stage in a journey that began several years ago.
Faced with unprecedented initial conditions - extraordinarily low interest
rates, bloated central bank balance sheets and high global indebtedness, both
private and public - monetary policy normalisation was bound to be challenging
especially in light of trade tensions and political uncertainty. The recent
bump is likely to be just one in a series.[57]
High trade tensions
Trading partner growth is expected to remain around trend in
2019 and 2020 but trade tensions ‘remain high’ and escalation continues to be a
significant risk.[58]
As at 4 March 2019, trade talks between the US and China on tariff increases
were still underway. Possible increases in US automotive tariffs or stricter
quotas remain a concern, in particular for Germany and Japan. There is evidence
that trade tensions are having adverse economic effects on trade and investment
intentions, and are increasing uncertainty about the growth outlook for many
economies.[59]
The undulating prospects of trade talks with China and
concomitant reactions in the markets provide a stark reminder that
protectionist policies represent a major threat to the growth outlook.[60]
Bank of England calculations suggest that world GDP could
fall by 2.5 per cent (over three years) following a 10 percentage point
increase in tariffs between the US and all of its trading partners (assuming
business confidence and financial conditions are also affected).[61]
By one estimate, a dramatic increase in trade policy tensions between
the US and Asia could slow Australian growth to below 2 per cent in 2019 and
2020.[62]
Political and policy uncertainty
Political uncertainty could dampen the global growth
outlook, particularly investment and consumption in the UK with Brexit
uncertainty; social unrest in France with resulting policy changes; and
increasing concerns about economic and fiscal policies in Italy.[63]
Figure 2
(on page 11) makes clear the recent increase in global uncertainty.
Shifting monetary policy rate expectations
Policy rate expectations have shifted globally, particularly
in the United States (see chart below). This has been attributed to reduced
expectations for growth and inflation, increased concerns about downside risks
and higher corporate risk premiums.[64]
Figure 3: Policy rate expectations
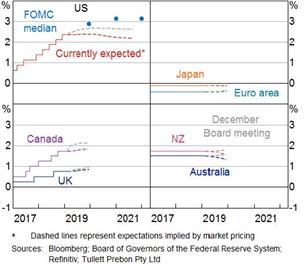
Source: C Kent, ‘Financial conditions and the
Australian dollar – recent developments’, address to XE Breakfast
Briefing, Melbourne, 15 February 2019. (The FOMC is the Federal Open Market
Committee is the monetary policymaking body of the Federal Reserve System.)
In a speech
on 12 February, Mark Carney, Governor of the Bank of England, noted that ‘global
momentum is now weakening in all major regions and downside risks have
intensified’.[65]
He attributed the deceleration to tighter financial conditions, rising trade
tensions and growing policy uncertainty. In Monetary Policy Committee
projections, ‘the balance of headwinds to growth and more accommodative policies
are expected to return global growth to around potential rates by the end of
the year’.[66]
Moderating growth in the United States
The US Federal Reserve is expected to pause its
tightening policy early in the year with rates not expected to rise until later
in the year or even until 2020.[67]
A partial US government shutdown and slowing global growth has added to the
headwinds, but NAB estimates that while growth may move modestly below trend
for a period, recession fears—at least in the short term—are overblown.[68]
Some concerns have been raised about the independence and
legitimacy of the US Federal Reserve as it comes ‘under fire’ from President
Trump.[69]
Mr Trump publicly criticised the Federal Reserve for raising its benchmark
interest rate.
If the Fed’s independence, or more likely its legitimacy, is
compromised, other branches of government could leverage their newfound
influence to ensure favourable short-term economic outcomes, resulting in
higher risks of inflation and ineffective monetary policy in the future.[70]
The RBA expects growth in the US to moderate partly as the
effects of recent fiscal stimulus begin to wane and as monetary policy becomes
less accommodative. The US Government shutdown during December and January is
expected to affect growth in the first part of 2019.[71]
The US accounted for 9.0 per cent of two-way trade with
Australia in 2016-17. The impact on Australia of a US slowdown will also depend
indirectly on the response by both the US and China to trade hostilities.
China slowdown
The slowdown in China is broad-based, across investment,
consumption and exports. The trade conflict with the US remains ‘a wild card’
with underlying tensions between the US and China hanging over business
activity and sentiment.[72]
Weaker domestic demand, incremental policy easing and a decreasing current
account surplus are expected to affect growth in the short term.
Household debt levels are elevated by emerging market
economy standards, but China’s overall private debt ratio stopped rising last
year in response to official action to curb shadow banking.
A controlled deceleration in growth is more likely.[73]
China recently announced additional stimulus measures to
support its economy:
While exact details of the stimulus package are yet to be
unveiled, the Chinese finance ministry suggested the measures would include
cutting value added tax for some companies, particularly in the manufacturing
sector, as well as rebates for other businesses to ward off a more damaging
slowdown. Some estimates we have seen this morning suggest the fiscal stimulus
could be worth in the order of 1% of GDP.[74]
A recent academic study on the impact of China’s slowdown on
Australia’s growth concluded that the effect on Australia of a permanent fall
in China’s growth rate from 10 per cent to annum to 7 per cent per annum
would be to reduce Australia’s growth rate by about 0.2 percentage points in
the short run and approximately 0.5 percentage points in the long run.[75]
Brexit uncertainty
There is still considerable uncertainty around Brexit. On 25
November 2018, UK and EU leaders approved the text of a
treaty-level Withdrawal Agreement and political declaration on the future EU-UK
relationship. The Withdrawal Agreement includes a transition period running
from 29 March 2019 to 31 December 2020, with the possibility of a one or
two-year extension. However, this Withdrawal Agreement has, to date, been
rejected (twice) by Parliament.[76]
Uncertainty over Brexit has fueled global
economic uncertainty, leading to consumers cutting back on spending, businesses
streamlining, closing or relocating, and financial markets demanding greater
risk premia to lend. Brexit will not allow the UK to benefit from the terms of
any free trade agreement between the EU and Australia. And negotiations for a
separate UK-Australia agreement can only start after Brexit is formalised.[77] After the initial impact
on financial markets following the Brexit vote in 2016, the economic impact of
a ‘no-deal’ Brexit is most likely to affect Australia through the UK’s
contribution to global economic growth.
Global risks
According to one survey, business gloom about the global
economy has continued to increase, with more businesses judging that the
probability of a sharp slowdown has increased over the past few months than at
any time since the start of the survey three years ago.[78]
Around 70 per cent of respondents think that the probability of a sharp
slowdown has increased, with trade concerns dominating in the short term. A key
emerging downside risk is perceived to be the Chinese economy. Over the next
five years, protectionism is viewed as a significant risk, along with a hard
landing in China, the global rise of populism and a break-up of the EU. Short-term
upside risks include a dissipation of trade war fears, strengthening emerging
market economies, delayed Federal Reserve tightening and falling oil prices.[79]
The impact on Australia of a US-led trade war—which has a
significant negative impact on China and the rest of the Asia-Pacific region—has
been estimated to slow GDP growth to around 1.0 per cent in 2020.[80] There is likely
to be a more limited impact on the Australian economy from faster Federal
Reserve tightening and a no-deal Brexit.[81]
As at January 2019, the Economist Intelligence Unit (EIU)
negative global risk scenarios included:
- a US-China trade conflict turning into a full-blown global trade
war (moderate risk, very high impact)
-
supply shortages leading to a globally damaging oil-price spike
(moderate risk, high impact)
- faster than expected US monetary tightening triggering a global
slowdown (low risk, very high impact)
-
a disorderly and prolonged economic downturn in China (low risk,
very high impact)
- a major military confrontation on the Korean peninsula (low risk,
very high impact)
- proxy conflicts in the Middle East disrupting global energy
markets (moderate risk, moderate impact)
- cyber-attacks and data integrity concerns (moderate risk,
moderate impact)
- territorial disputes in the South China Sea leading to an
outbreak of hostilities (low risk, high impact)
- political gridlock leading to a disorderly no-deal Brexit (very
low risk, low impact).[82]