Issue
Australia’s long-term economic prosperity is under threat
due to a sustained slowdown in productivity growth. Structural challenges have
exacerbated this, and the policy responses to COVID-19, while protecting jobs
and businesses, may have hindered longer-term productivity growth. Renewed
reform and innovation could reverse this trend.
Key points
- Between
2010–20, Australia recorded its weakest productivity growth in 60 years.
- Reduced
multifactor productivity (MFP) was the largest contributor to this slowdown,
reflecting reduced efficiency in combining labour and capital.
- COVID-19
policy responses, such as JobKeeper, may have impeded productivity-enhancing
reallocation of labour and capital.
- Modest
productivity growth improvements can have major long-term economic benefits,
including significantly higher gross domestic product (GDP).
Context
Productivity measures how efficiently inputs (such as
capital and labour) are used to produce outputs (goods and services).
Productivity growth occurs when an economy produces more output with the same
input, maintains output levels using fewer inputs, or a combination of both.
Labour productivity has accounted for over 70% of
Australia’s per capita economic growth over the past 40 years. Australia’s
strong productivity performance in the late 20th century was driven by major
economic reforms.
The Productivity Commission (PC) proposed comprehensive
reform agendas in its 2017 and 2023 reviews. Successive governments have not
made formal responses to the specific review recommendations. The PC is working on 5
‘productivity pillar’ inquiries, with reports due to be delivered to the
Government in late 2025.
The main driver of economic growth
Increasing population, workforce participation and
productivity drive economic growth. In Australia, productivity has historically
been the main driver and key determinant of rising per capita incomes and
living standards. This is achieved through:
-
cheaper goods and services
-
improved quality of goods and services
-
new goods and services which provide a benefit
According to the Treasury’s Intergenerational
Report 2023 (2023 IGR), over the past 40 years labour productivity per hour
worked accounted for over 70% of the real GDP growth per person (Figure 1
below). However, average productivity growth over the decade to 2020 was the
slowest in 60 years (2023 IGR, p. 81). Other advanced economies have also
experienced falling productivity growth, with the 2023 IGR suggesting there are
shared causal factors such as:
- reduced
competition
- slow
uptake of technology adoption
- growing
service sectors and
- low
human capital accumulation.
Figure 1 Drivers of real GDP per person growth past 40 years to
2023
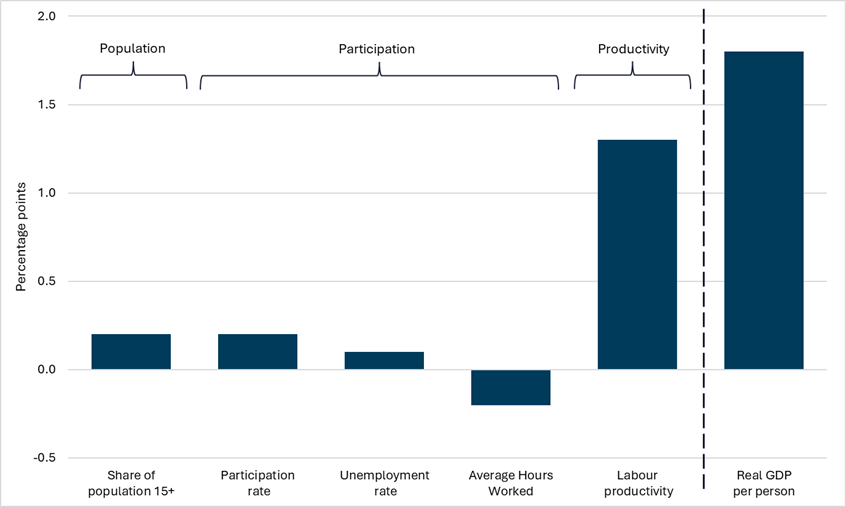
Source: Treasury, Intergenerational
report 2023: Australia’s future to 2063, p. 25.
How is productivity measured?
Box 1 below outlines some key productivity measurement
concepts.
According to annual ‘market sector’ LP and MFP changes since
1995–96 (Figure 2), labour productivity grew 1.1% and MFP rose 0.1% in 2023–24.
Figure 2 Market sector, productivity growth – hours worked basis
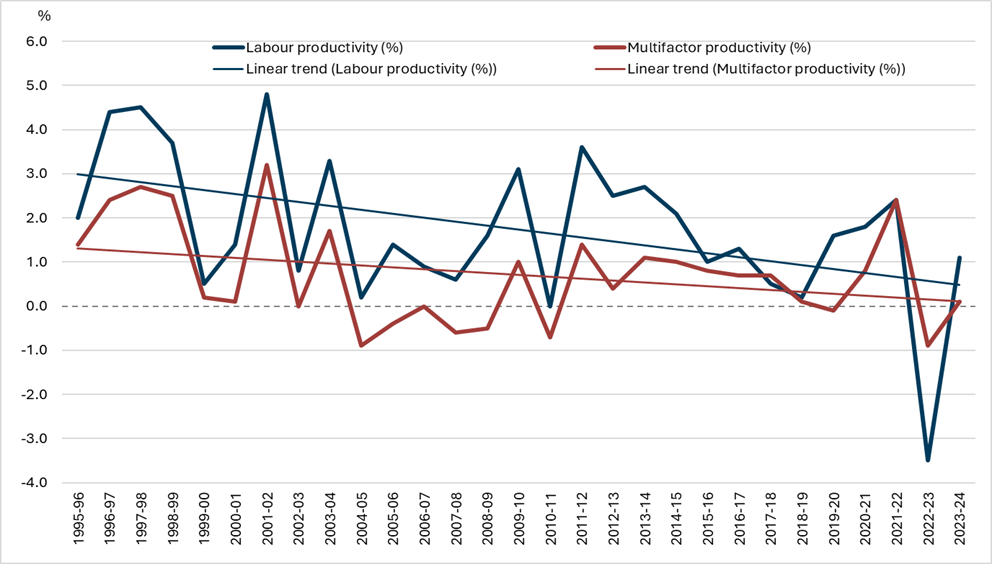
Source: ABS, Estimates of Industry Multifactor
Productivity, 2023–24,
released 22 January 2025.
While productivity measures would ideally cover all economic
activities, they currently incorporate only three‑quarters of the economy.
Sectors with measurement limitations comprise the ‘non‑market’ sectors
and ownership of dwellings.
‘Non‑market’ sectors provide government-funded outputs
to consumers free of charge or at non‑market prices. Examples include Public
Administration and Safety, Education and Training, and Health Care and Social
Assistance. Without meaningful price signals, measuring
MFP is very difficult and so the Australian Bureau of Statistics (ABS) does
not produce MFP data for these sectors. Ownership of dwellings is also excluded
because no employment is associated with it.
Importantly, cyclical factors can cause large year‑to‑year
productivity changes. For example, in economic downturns firms tend to retain
skilled labour they will still need in the future. Such labour (and related
capital) may only be partially utilised, reducing annual productivity.
Accordingly, changes in productivity growth are best observed over longer
‘growth cycles’ rather than through annual movements.
Productivity growth in Australia has slowed
Since reaching 3% in the growth cycles spanning the late
1980s to early 2000s, Australia’s aggregate LP growth has consistently been below
2% and was just 1.1% in the latest cycle (Figure 3). While capital deepening
has continued to grow at a reasonable rate, MFP growth is
now lower, and in 2003–04 to 2009–10 actually went backwards.
Figure 3 Market sector labour productivity decomposition –
average growth per cycle
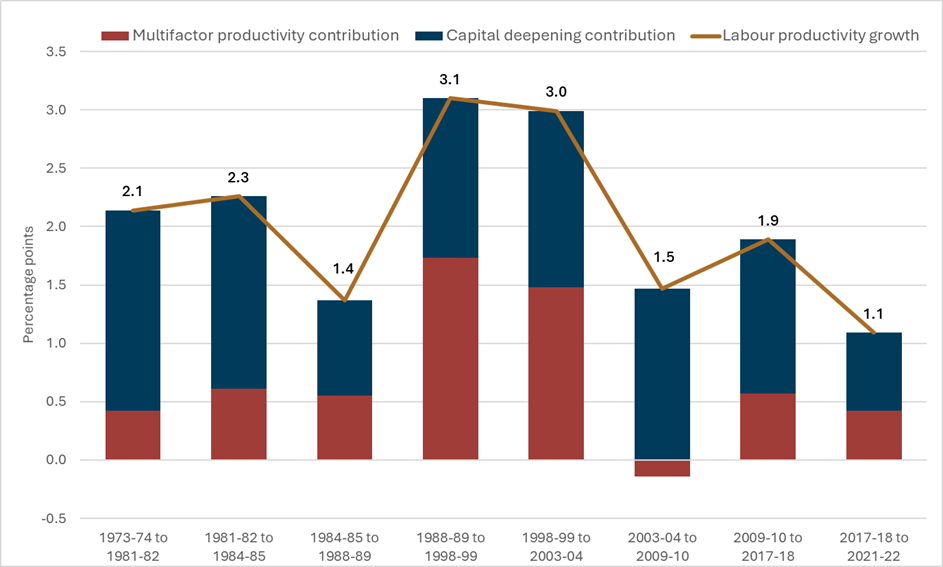
Source: ABS, Estimates
of Industry Multifactor Productivity, 2023–24, released
22 January 2025.
According to the PC,
some of the weakness during this time is explained by the mining boom, which
led to lower measured productivity growth in 2 ways:
- Substantial
infrastructure (and therefore a lengthy construction period) was required
before materials were mined. The multiple-year lag meant that capital and
labour were being used without immediately generating materials that could be
sold, lowering measured productivity.
- High
commodity prices meant it become profitable to mine poorer quality reserves,
that required more capital and labour for a given amount of mined material.
For the more recent growth cycles, the 2023
IGR has similarly cited declining competition, economic dynamism and
regulatory reform as structural causes for the productivity growth slowdown.
The COVID-19 pandemic was also
significant, leading to Government policy responses including:
While such policies protected jobs and businesses, as the
economy recovered these measures impeded potentially more productive workforce
changes. Consequently, through prioritising job security and business
continuity, government policy responses may have reduced potential productivity
growth.
How can Australia improve its labour productivity?
What has helped previously
The superior productivity performance from the late 1980s
through to the early 2000s is widely attributed to successive governments’ microeconomic
and macroeconomic reforms prior to and during this period. These reforms
included:
-
movement towards medium‑term monetary and fiscal policy
frameworks (targeting inflation and a balanced budget over the economic cycle)
-
floating the exchange rate, liberalising capital markets and removing
interest rate controls
-
reduced industry assistance measures and tariffs
-
taxation reform
-
privatising government business enterprises
-
moving from centralised wage determination to enterprise
bargaining
-
establishing the National
Competition Policy.
These reforms opened the economy to foreign competition,
increased capital flows, improved the efficiency and flexibility of domestic
markets and delivered greater macroeconomic stability.
Looking to the future
More recently, the Productivity Commission has released two
5-year Productivity Reviews; the first in 2017 and the second in 2023.
The Productivity Commission’s first review, Shifting the
dial, recommended several options for how governments can positively
influence labour productivity growth, including:
-
making Australia’s health system more outcome-oriented, rather
than paying for services
-
creating a high quality and adaptive education and training
system and ensuring a
well-functioning labour market -
improving town and city functionality through improved public
infrastructure, road funding and investment, planning and land use policies,
and access to housing
-
improving market efficiency through improved competition and regulatory
frameworks
-
better intergovernmental relations and public finance management to
develop stronger policy development and delivery capabilities.
Although the Australian Government customarily responds to
Productivity Commission recommendations, this did not occur for this inquiry.
The Commission’s second 5-year
Productivity Inquiry included 71 recommendations, within 5 ‘reform
pillars’.
While the Australian Government has not issued a formal
response to the specific recommendations, the Treasurer did publish a media
release discussing generalities. He then commissioned
the Productivity Commission to undertake a series of inquiries into how to
boost productivity across the 5 ‘reform pillars’:
The terms
of reference for the inquiries noted they should ‘identify the highest
priority reform areas under each of the five pillars’ and emphasise
regulatory reform. The interim reports for these inquiries are expected to
be released in July or
August 2025.
Improved productivity growth has the starkest impact when
looking at the long‑term implications. For example, The 2023
IGR assumed productivity growth of 1.2%; however, just a 0.3% increase to
this would create a projected 9.5% lift to GDP in 2062–63 (p. 23).
Conclusion
The Productivity Commission is currently working on further
inquiries to assist with productivity, including workforce adaptability,
digital innovation, market dynamism, non-market sector efficiency, and
cost-effective climate transition. The government’s response to these
recommendations will be critical to reversing the productivity slowdown.