The Parliamentary Library aims to provide an effective knowledge centre for the
Parliament through the provision of information, analysis and advice. These
services are provided through two sub programs:
- Research Services: these services include responding to requests from
individual parliamentary clients for information and research, and the
production of print and electronic publications, and
- Library Collections and Databases: information services are provided to the
Library’s clients by acquiring and providing access to information
resources, through the selection, processing and indexing of material for
library and media databases in ParlInfo Search.
Staff from the Office of the Parliamentary Librarian contribute to the work of
both programs.
Performance is assessed using indicators that cover quality, quantity and price.
Indicators, performance results and relevant comments are shown against each of
the Library programs.
Progress in key projects identified in the Library’s Business Plan 2017–18
was the subject of discussion in the previous section. The Performance Report
focusses on analysis of the Library’s achievement against service standards set
out in that same document.
Research services
The services contributing to this program are as follows:
- commissioned information, research and advisory services—these are tailored
and confidential responses prepared following requests from individual
parliamentarians and their staff, and other parliamentary clients, and
- general distribution publications (publications)—these are prepared where
strong client demand is anticipated for briefing on specific policy issues.
Publications include the Parliamentary Handbook, Briefing Book,
Budget Review, Bills Digests, research papers, quick guides and FlagPost
blog posts. Publications are available to clients and the public, through
the Internet.
Table 23: Research services
| Deliverable |
Measure |
Performance |
|
|
|
2014–15 |
2015–16 |
2016–17 |
2017–18 |
| Individual client
requests |
Percentage of primary clients using the
service
Target: 100%
|
100% |
100% |
100% |
100% |
Number of individual client requests
completed
Target: 13,000
|
12,656 |
13,113 |
11,681 |
11,656 |
| Self-service
requests |
Number of online uses of the
Parliamentary Library’s publications, including the Parliamentary
Handbook, through ParlInfo and the Internet
Target:
5.4m
|
9.14m |
6.74m |
6.4m |
7.2m |
| Publications |
Number of publications
produced
Target: 260
|
328 |
267 |
280 |
295 |
| Client training and seminars |
Attendance at training
courses and events
(e.g.
Vital Issues Seminars)
Target:
500
|
418 |
729 |
1,101 |
803 |
Table 24
illustrates the costs associated with providing research services.
Table 24: Research services—price indicators
| Deliverable |
Measure |
Performance |
| 2014–15 |
2015–16 |
2016–17 |
2017–18 |
| Cost of research
services |
Average cost per individual client
request
|
$500.87 |
$527.22 |
$556.39 |
$562.03 |
| Average direct cost per
self-service client request
(staff time only)
|
$0.11 |
$0.11 |
$0.16 |
$0.12 |
Client requests
During 2017–18, 100 per cent of the Library’s primary clients
(parliamentarians’ offices, including ministers’ offices) used the client
request service at least once, a considerable achievement given the
unusually high number of new parliamentarians taking their seats during the
financial year.
The Library answered 11,656 individual client requests in 2017–18,
below its target of 13,000.
However, analysis of this and associated data present a more complex
picture.
Figure 8: Client requests—relative indicators
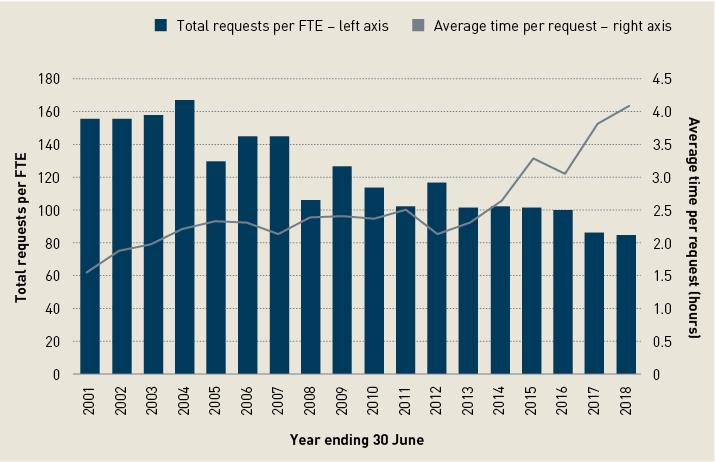
The number of client requests is a demand driven indicator, representing
a best estimate of how many requests the Library expects to complete
annually. And complex, multi-part requests are generally recorded as a
single client job although they may require significant and discrete
input from researchers in different sections.
Another element in assessing performance relates to hours spent on client
requests. In 2017–18, hours spent responding to parliamentarians
enquiries again increased by five per cent compared to 2016–17 figures
(44,503 compared to 42,178 the previous financial year). And the 2016–17
result had shown an increase of almost 13 per cent compared to 2015–16
(42,178 compared to 37,343).
Hours spent on client services to parliamentary committees, parliamentary
departments and reciprocal arrangements increased by just over 30 per
cent.
2017–18 saw the continuation of the trend towards fewer but
increasingly complex client requests. As illustrated in Figure 8,
Library data continue show an overall decline in the number of completed
client requests of 46 per cent per FTE between the financial years
2000–01 and 2017–18. However, while year-to-year outcomes vary,
over the same period there has been an overall increase in the average
amount of time spent on individual requests. The average amount of time
per request in 2017–18 was 4.1 hours, over two and half times the
2000–01 figure of 1.5 hours.
The Library will continue to monitor usage closely and consult with
clients to ensure services are appropriately targeted.
Publications
In meeting the need to provide high quality information, analysis and
advice to parliamentarians, the Library produces information and advice
for individual clients on an ‘in confidence’ basis. It also produces
publications for broader distribution in areas where there is strong
client interest and demand, or where such demand is anticipated.
Figure 9: Distribution of client service hours by
service type 2017–18
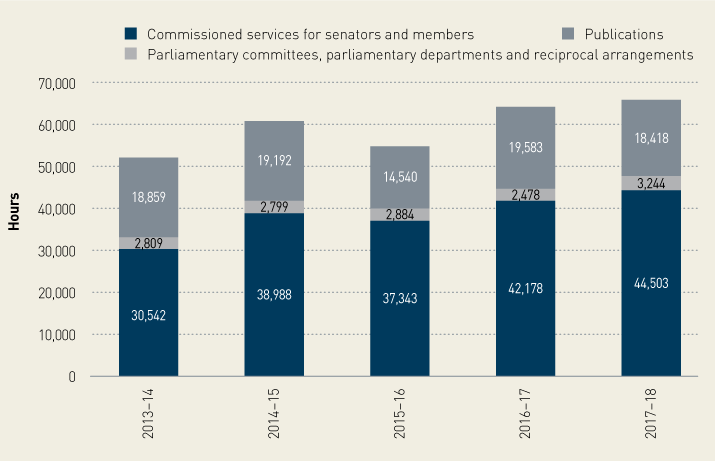
In 2017–18, the Library issued 295 new or revised research
publications. Hours spent on publications decreased slightly to 18,418
(compared to 19,583 hours the previous financial year).
Of all Library publications, the most heavily used by clients, and most
keenly awaited, remain Bills Digests. These provide an independent
perspective on, and analysis of, legislation before the Parliament. The
Library published 133 Bills Digests in 2017–18, compared to 121 in
2016–17 and 117 in 2015–16. No digests were produced on private
senators’ or members’ Bills. Forty two digests were not published in
time for debate in the first chamber (compared to 30 in 2016–17 and 43
in 2015–16). Digests were not produced for 24 Government Bills (compared
to 26 in the previous financial year. Of these:
- one passed both Houses on the day it was introduced
- two were replaced and Digests were published for the replacement
Bills, and
- nine were the subject of Flagposts.
In the context of prioritising research work, Bills Digests and client
requests receive the highest priority, with other publications worked on
as time permits.
Client training and seminars
The Parliamentary Librarian participated in induction sessions organised
by the chamber departments for new senators and members. Library staff
also served as contact officers for all new senators and members.
During the year, Library induction and orientation services continued to
be successful in providing, through individual and small group sessions,
a timely and detailed introduction to Library services.
The Library supplements its regular one-on-one training with other
training programs including ‘drop in’ sessions in the Senators’ and
Members’ Reading Room during sitting weeks. In 2017–18, sessions
were offered on news services, new releases of Census data, e-books, and
the new ParlMap service.
One of the recommendations of the Client Service Evaluation 2015 was that
the Library focus more on providing orientation and training, and
consider conducting some of these in other capital cities to make it
easier for electorate staff to attend. The Library subsequently began a
low-key program of electorate office visits, which are undertaken as
time and resources permit. In 2017–18, visits were undertaken to
37 electorate offices in New South Wales, Victoria, Queensland, Western
Australia, and Tasmania, exceeding the target of 20 visits for the
financial year.
Since 1986, the Library has been running a program of lectures and
seminars that bring notable speakers to the Parliament to give
parliamentarians and their staff the opportunity to hear, first-hand,
expert opinion on a range of currently relevant topics. In addition to
the Budget seminars, the Library hosted the following lectures
and seminars for clients:
- Australian Crime statistics—context is everything, Professor Toni
Makkai, Emeritus Professor in the Centre for Social Research and
Methods, Australian National University
- Taking stock of section 44 of the Constitution, Professor Anne
Twomey, University of Sydney
- Alfred Deakin as Prime Minister, Emeritus Professor Judith Brett,
LaInformation access services—deliverables
Trobe University, and
- Australia’s anti-money laundering regime in the international
context, Liz Atkins PSM, former Deputy CEO of AUSTRAC.
Most lectures are available for download from the APH website.
Client satisfaction with requests and
publications
Table 25: Research services—key performance indicators
| Deliverable |
Measure |
Performance |
| 2014–15
|
2015–16
|
2016–17
|
2017–18
|
| Client satisfaction with
requests and publications |
High level of customer
satisfaction
Target: 95%
|
93% |
93% |
93% |
94% |
Client service delivered to timeliness service
standard
Target: 90%
|
89.76% |
90.4% |
97.9% |
99.33% |
| Number of complaints from clients remains low
|
2 |
2 |
1 |
2 |
The 2017 client service evaluation found the general response to the
Library was very positive. Satisfaction among senators, members, and
their staff is high at 94 per cent (though slightly below the target of
95 per cent), with 99 per cent indicating they would recommend the
Library’s services to a colleague. Most respondents considered Library
staff to be hard working, professional and friendly, and services to be
of a high quality.
In 2017–18, the Library also continued its program of consultation
and outreach to parliamentary committees, with the number of client jobs
increasing to 198 from 182 in the previous financial year.
Research Branch received two complaints in 2017–18, both relating
to the handling of a research request.
Library Collections and Databases
The services contributing to this program include:
- the Library collection—development of the collection to meet users’
needs and provision of access through the catalogue and ParlInfo
Search
- online full-text content such as news clippings
- media services—desktop access to television and radio news and
current affairs programs broadcast in Canberra, provided to senators
and members for their parliamentary duties
- commercial databases—including online full-text journal and
newspaper services available through the Library Client Services’
portal and the Senators’ and Members’ Services Portal, and
- client services including the Central Enquiry Point and self-help
services.
As far as possible, usage rates of all of these services are monitored to
ensure that they remain relevant and are of practical assistance to
senators, members, and their staff.
Table 26: Information access services—deliverables
| Deliverable |
Measure |
Performance |
| 2014–15 |
2015–16 |
2016–17 |
2017–18 |
| Material added to Library databases |
Number of items added to the
Library’s Electronic Media Monitoring Service and to ParlInfo
databases
Target: 150,000
|
172,766 |
177,644 |
168,788 |
175,249 |
| Material added to Library
collection |
Number of new titles (books and
serials) added to the Library’s catalogue
Target:
5,000
|
6,530 |
7,318 |
6,575 |
6,378 |
Percentage of titles (books and serials) in Library’s
collection available to clients online in
full-text
Target:
44%
|
38.2% |
41.2% |
42.2% |
45.5% |
| Use of the Library collection and databases
|
Use of the collections and databases,
including loans from the collection, radio and television
programs from the Electronic Media Monitoring Service, and from
ParlInfo databases
Target: 4 million
searches
|
4.55m |
4.44m |
3.81m |
3.95m |
Table 27: Information access services—price indicators
| Deliverable |
Measure |
Performance |
| 2014–15 |
2015–16 |
2016–17 |
2017–18 |
| Cost of information
services |
Average cost per item added to the
Library’s collection
|
$162.85 |
$155.81 |
$152.91 |
$162.93 |
| Average cost per item added to the Library’s
databases
|
$14.79 |
$17.47 |
$17.85 |
$14.62 |
| Average cost per use of the Library’s databases and collection
|
$1.42 |
$1.57 |
$1.85 |
$1.59 |
Material added to Library databases
In 2017–18, the Library selected and indexed approximately 9,231
newspaper clippings a month. Of all the Library databases that are
indexed for ParlInfo Search, the newspaper clippings accounted for 95
per cent of the indexed content.
Since the introduction of the automated Library Authoring System and
Thesaurus (LAST) in 2010, the Library has been able to publish the
latest newspaper clippings in ParlInfo Search, as well as produce the
senators’ and members’ news clips of the day by 7:30am. Data shows that
the introduction of LAST significantly improved the Library’s
productivity in the selection and indexing of newspaper clippings. Since
LAST was introduced, the Library has reduced the amount of time spent on
selection of newspaper clippings by 26 per cent and indexing by 37 per
cent. This is compared to the 2016–17 outcomes of 42 per cent and 21 per
cent respectively. We have also seen an increase in the selection and
indexing rates, with the selection increasing by 27 per cent since
2009–10 and the indexing rate by 49 per cent, and the overall rate by 39
per cent (compared to 22 per cent in 2016–17).
Material added to the Library collection
The number of new titles (books and serials) added to the Library’s
catalogue significantly exceeded the 5,000 target at 6,378.
The percentage of titles available online (full-text) increased from 42.2
per cent to 45.5 per cent, slightly exceeding the annual target of
44 per cent.
Use of the Library’s collection and
databases
The target figure of four million uses of the Library’s collection and
databases was not met, with 3.946 million uses being reported. Last
year’s annual report noted that usage figures have been trending down
since a highpoint in 2013–14, and the resultant increase in the KPI from
3.8 to 4 million in 2014–15 (in response to the increase in the number
of searches between 2012–13 and 2013–14).
The newspaper clippings database remains one of the most frequently
selected databases.
The trend downwards in the internal use of the Library’s databases since
2013–14 likely reflects the Library’s investment in improving access to
its news services and clients’ increasing use of the iSentia
Mediaportal. As at 30 June 2018, 99 per cent of clients’ offices have a
logon to this service and have set up alerts to push news stories
directly to their inbox and the associated mobile app. Previously,
Library clients needed to rely primarily on ParlInfo Search to access
the daily clips. This change has a flow-on effect to the recorded KPI
for use of the Library collections. Fewer clients are accessing news
clips via ParlInfo Search because the Mediaportal provides more mobile
and convenient access. While use of the Library’s databases has reduced,
access to news services has improved.
Figure 10: Use of the print collection
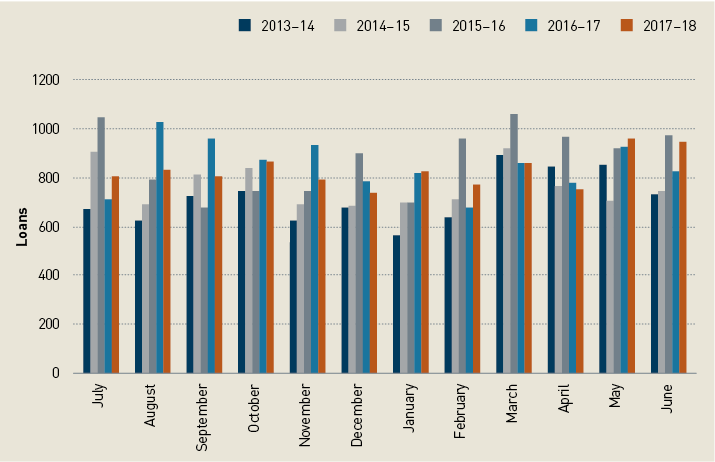
Use of the print collection remained stable, with a total of 9,913 loans
during 2017–18 (compared to 10,623 in 2016–17). The 2017 client
evaluation of Library services found that use of the Library’s print
collection had fallen slightly from 85 per cent in 2015 to 75 per cent
in 2017 (after increasing significantly from 61 per cent in 2012). This
decrease may be a result of the increased use of ebooks.
Though still quite low when compared to usage of the print collection,
ebook usage increased significantly during 2017–18, with 1,100
loans being processed (compared to 478 the previous financial year).
Overall, the proportion of print versus electronic loans during 2017–18
was 90 per cent print and 10 per cent electronic. In 2016–17 it was 95.5
per cent print and 4.5 per cent electronic. This increase may be
attributable to the Library’s increased promotion of the ebook services
and the implementation of the EZproxy system which provides a more
seamless (single sign-on) access to our subscribed ebook collections
outside the PCN.
Table 28: Subprogram 2—collections and databases—key performance indicators
| Deliverable |
Measure |
Performance |
| 2014–15 |
2015–16 |
2016–17 |
2017–18 |
| Client satisfaction with
collections and database services |
High level of customer
satisfaction
Target: 95%
|
93% |
93% |
93% |
94% |
Number of urgent new titles (books and serials) added to
the Library’s catalogue within timeliness service
standard
Target: 100%
|
100% |
100% |
100% |
100% |
Senators’ and members’ offices using the iSentia
Mediaportal
Target: 90%
|
79.6% |
89% |
96% |
99% |
Senators’ and members’ offices using social media
monitoring service
(new KPI
2016–17)
Target:
45%
|
- |
- |
56% |
66% |
New items added to the Library’s Electronic Media
Monitoring Service and the ParlInfo newspaper clippings database
within timeliness service standard
Target:
95%
|
96% |
94.7% |
94.4% |
99.07% |
| Number of complaints from clients remains low
|
1 |
0 |
1 |
0 |
Client satisfaction with Library Collection and Databases
See the discussion on client satisfaction indicators.
Cataloguing
The key performance indicator for ‘urgent new titles (books and serials)
added to the Library’s catalogue within timeliness service standard’
measures timeliness in relation to cataloguing items obtained as a
result of direct client requests (with a turnaround deadline of 24
hours). These items are classed as urgent and are catalogued as a
priority by Collection Management staff.
The cataloguing team met both its timeliness target for direct client
requests and, as noted above, exceeded the target (5,000) for the number
of new titles (books and serials) added to the Library’s catalogue by
processing 6,378 titles. Despite the increased number of titles
processed, the team also significantly exceeded its target of 85
per cent for adding routine items (those selected by the Library’s
Acquisitions staff) to the catalogue within the two-week service
standard, with 100 per cent of material being added within this
time-frame.
Expansion of news services
The Parliamentary Library provides comprehensive news services to
clients. The Library is proactive in its endeavours to enhance its news
services within its available budget. During 2017–18 the news
services were expanded to include an additional 10 daily News Corp
digital titles to Library clients. An expansion of the Viewer Access
Satellite Television (VAST) satellite dish added a further 12 rural ABC
radio channels and seven metropolitan ABC TV channels to the Electronic
Media Monitoring Service (EMMS). Several other services were procured in
2017–18 and will be implemented in July 2018. These include: the
Front Pages service that conveniently bundles all daily front pages of
national and metropolitan newspapers; access to Analytics, another
service available through the iSentia MediaPortal that provides
quantitative analysis tools for measuring media coverage; and IP access
to The West Australian.
The Library has had a strong focus on broadening the scope of news
services for the Parliament and making them more convenient to access.
The costs for online news services for the Parliament are funded as
business as usual through the Information Resources budget. In 2017–18,
the Library spent $0.546 million on all its news services. This includes
online news services, news databases and hardcopy newspapers located in
the Newspaper Reading Room.
Social media monitoring
Buzznumbers, which was rolled out in July 2016, provides access to social
media commentary from assorted blogs, Twitter and Facebook. Users can
set up campaigns in the product to monitor particular areas of interest
and receive alerts. During the year 66 per cent of senators’ and
members’ offices made use of the service (target 45 per cent).
iSentia Mediportal
Senators and members are able to access a wide variety of metropolitan
and regional press and broadcast news media through the iSentia
Mediaportal, including news from more than 300 regional radio and
television stations. Clients are able to set up alerts to push news
stories directly to their inbox and to have easy access to the news
services even when they are not on the parliamentary network.
Use of this service has grown significantly since it was introduced in
2013–14. As of 30 June 2018, 99 per cent of clients have a logon to
this service, well above the target of 90 per cent. These users have
created over 1,580 alerts.
Performance
The news services’ KPI in table 28 above combines the performance
outcomes of the daily press clips service and Electronic Media
Monitoring Service against their individual performance benchmarks or
standards. Performance against this KPI was excellent, with both teams
overall achieving 99.07 per cent against a target of 95 per
cent.
Complaints
The Library Collections and Databases Branch received no complaints in
2017–18.
Footnotes:
As measured
in
Uncommon Knowledge, Australian Parliamentary Library: client
service
evaluation 2015.
As measured
in
Uncommon Knowledge, Australian Parliamentary Library: client
service
evaluation 2015.
As measured
in
Uncommon Knowledge, Australian Parliamentary Library: client
service
evaluation 2015.
As measured
in
Leapfrog Research Evaluation of Parliamentary Library
Services,
2017
Department of
Parliamentary Services, Annual Report 2016–17, 2015. p. 163–64
As measured
in
Uncommon Knowledge, Australian Parliamentary Library: client
service
evaluation 2015.
As measured
in
Uncommon Knowledge, Australian Parliamentary Library: client
service
evaluation 2015.
As measured
in
Uncommon Knowledge, Australian Parliamentary Library: client
service
evaluation 2015.
As measured
in
Leapfrog Research Evaluation of Parliamentary Library
Services,
2017