Appendix 1
Environmental management
DPS reports annually on elements of environmental performance, in line with the Environment Protection and Biodiversity Conservation Act 1999 (EPBC Act), for the management of resources for which it is responsible.
DPS also reports under:
- the Energy Efficiency in Government Operations (EEGO) Policy
- the National Environment Protection Measures (Implementation) Act 1998
- the National Pollutant Inventory (NPI).
Ecologically sustainable development
The objective of Ecologically Sustainable Development (ESD) is defined as ‘development that improves the total quality of life, both now and in the future, in a way that maintains the ecological processes on which life depends’.
DPS reports annually on ESD through this report.
Identification, management and monitoring of environmental impacts
DPS aims to ensure that the vital functions of Parliament House operate effectively, while minimising resource consumption and waste production by:
- monitoring environmental performance
- implementing programs and projects to improve environmental outcomes
- developing plans to improve environmental sustainability.
Many activities at Parliament House—including maintenance, engineering, landscaping, ICT, catering and office-based services—have the potential to affect the environment through energy and water consumption, greenhouse gas emissions and waste generation. DPS works to improve outcomes in these areas in a number of ways.
In 2013–14, actions included:
- replacement of lights with more energy efficient lighting
- fine-tuning and optimisation of major energy consuming equipment
- investigative studies including a ‘Building Condition Assessment’ and a ‘Lake Water Supply Feasibility Study to Reduce Potable Water Usage’.
DPS also emphasises environmental improvements when undertaking the planning and delivery of infrastructure projects. Project activities adhere to an environmental checklist that includes consideration of:
- whole-of-life principles
- reuse and recycling of materials where possible
- energy, water and waste minimisation.
A major project completed in 2013–14 was the new Parliamentary Budget Office (PBO) which occupies 640m² of floor space. This refurbishment project incorporated:
- use of more energy efficient lighting and installation of occupancy sensors
- reuse of existing mechanical infrastructure and equipment
- reuse and recycling of construction waste where possible.
Communication and promotion
DPS provides information on its environmental performance and initiatives through its website, internal circulars and newsletters.
DPS promotes and participates in annual initiatives to encourage and educate building occupants to be more sustainable, including National Ride to Work Day and National Recycling Week.
In 2013–14, DPS showcased important sustainability initiatives at Parliament House during a site visit by the International Property Council—comprising government property representatives from the United States, Canada, the Netherlands, New Zealand and United Kingdom—and guests of the Department of Foreign Affairs and Trade.
Environmental performance
Water consumption
Total water consumption for 2013–14 was 192,463kL representing a decrease of 6 per cent on 204,547kL consumed the previous year. Landscape water consumption increased slightly from 113,114kL in 2012–13 to 114,587kL in 2013–14, representing an increase of 1 per cent. Annual water consumption for Parliament House is shown in Figure 16.
Figure 16: Annual water consumption from 1988–89 to 2013–14
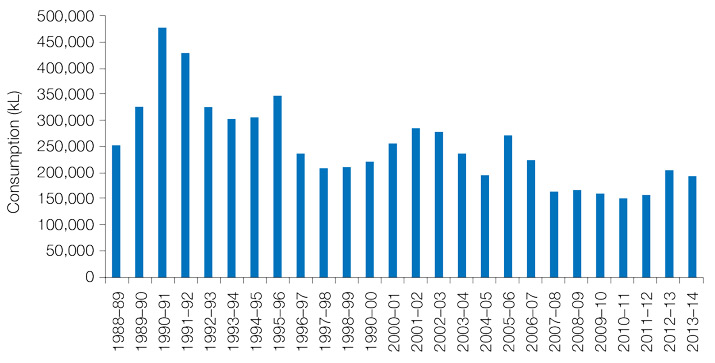
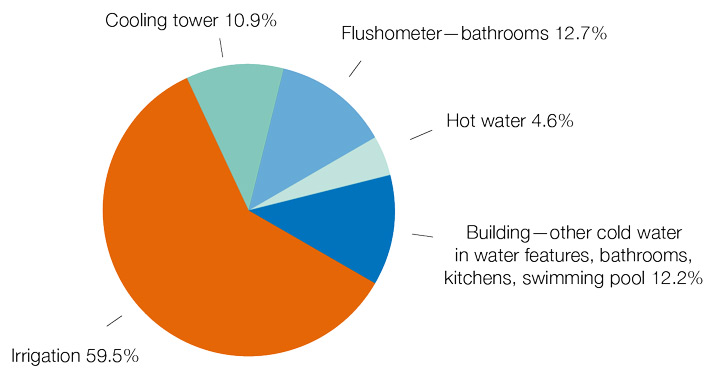
Figure 16 shows water consumption for the last two reporting periods has increased compared to previous years. This is attributable to recent high irrigation demands in the landscape which, as shown in Figure 17, accounts for almost 60 per cent of total water consumption.
High irrigation demands over the last two years are a result of extremely hot and dry weather conditions during the summer periods. Record breaking temperatures in Canberra over summer resulted in very high irrigation demands on the hottest days—up to one megalitre of water. The landscape irrigation system utilises soil moisture sensors to ensure the most precise and efficient use of water.
As warmer and drier climatic conditions are predicted to become more frequent in the Canberra region, landscape water requirements at Parliament House are expected to increase over time.
Figure 17 shows a breakdown of water use during 2013–14.
Figure 17: Water use during 2013–14
Building water consumption in 2013–14 was 77,876kL, a decrease of 15 per cent on 91,433kL consumed the previous year. The reduction in building water use was mainly due to the federal election period in late 2013, in which building occupancy rates were lower and water use associated with air-conditioning, toilet flushing, bathrooms and kitchens was less.
In June 2014, DPS reactivated a number of water features around the building that were previously decommissioned as part of ACT water restrictions.This will result in a small increase to annual building water consumption. DPS is currently supplying four water features including the Forecourt pond, with recycled water discarded from the cooling tower.
Water-saving initiatives
Alternative water supply
DPS is investigating ways to minimise the amount of high quality drinking water that is being utilised for the landscape which currently accounts for the majority of water use at Parliament House.
In 2013–14, DPS initiated a feasibility study into an alternative more sustainable water source to meet the irrigation demands of the Parliament House landscape. A report due in late 2014 will determine whether the extraction of water from Lake Burley Griffin to irrigate the landscape is viable. The report will consider aspects such as water quality issues, long-term supply needs, other uses of lake water, shared infrastructure in the Parliamentary Triangle, National Capital Authority (NCA) requirements, the Murray–Darling Basin Plan, and health and social considerations.
Water harvesting and recycling
Parliament House has three 45,000 litre rainwater harvesting tanks used to supply water
to parts of the landscape and the Forecourt water feature.
Discarded water from the air-conditioning system cooling tower is recycled using a Reverse Osmosis (RO) system capable of treating 30,000 litres of water a day. The RO currently supplies recycled water to four water features including the main Forecourt pond.
Energy consumption
In 2013–14, energy consumed at Parliament House and by DPS vehicles was 137,094 GJ, representing a decrease of 4.3 per cent from the previous year. Electricity and gas consumption decreased by 4 per cent, transport energy decreased by 40 per cent, and diesel fuel energy reduced by 47 per cent compared with 2012–13. Table 42 shows Parliament House building energy consumption and by DPS vehicles.
Building energy use comprises:
- natural gas for heating, general hot water and in kitchens
- electricity to power office lighting, mechanical services, lifts, cooling
and ICT equipment
- a small amount of diesel mainly used for testing the emergency backup generators.
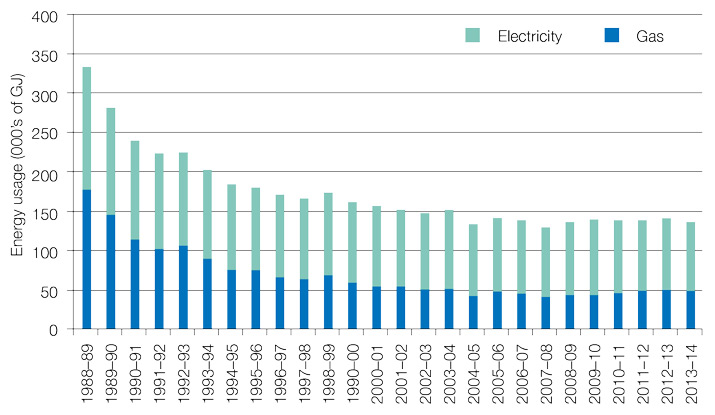
Figure 18 shows annual gas and electricity consumption since the building opened in 1988.
Table 42—Energy consumed at Parliament House and by DPS transport
|
Indicator
|
Energy Consumption (GJ)
|
|
2011–12
|
2012–13
|
2013–14
|
|
Parliament House building1
|
139,563
|
142,226
|
136,450
|
|
Transport–passenger vehicles
|
1,6252
|
644
|
261
|
|
Other transport3
|
441
|
424
|
383
|
|
Total energy consumption
|
141,629
|
143,294
|
137,094
|
1. Includes electricity, natural gas and diesel (non-transport).
2. Includes previously collected vehicle data of other Parliamentary Departments not under DPS management.
3. Includes LPG, diesel and petrol used for maintenance and loading dock vehicles.
Figure 18: Annual electricity and gas consumption from 1988–89 to 2013–14
Electricity, gas and diesel consumption
Figure 18 shows Parliament House electricity and gas usage has plateaued in recent years. Contributing factors include increasing building operational requirements, higher gas usage, pressures on space, and competing priorities within the capital works budget to effect new energy efficiency measures.
Although overall energy use has plateaued, electricity consumption in 2013–14 was the lowest achieved at Parliament House since the building opened—a reduction of 44 per cent since 1988–89.
Higher gas consumption, which has increased by 18 per cent since 2007–08, is a
main contributor to the recent energy plateau and has offset positive electricity savings. The increase in gas consumption is mainly due to ageing infrastructure such as the large boilers and associated infrastructure required for heating the building.
In 2013–14, diesel fuel consumption has declined due to maintenance activity on the high-voltage diesel generator resulting in less frequent operation during the year.
Energy intensity
Energy intensity is a key indicator in the ‘Energy Efficiency in Government Operations’ (EEGO) Policy. As a unique building, Parliament House is difficult to benchmark against other office buildings, and for reporting purposes energy intensity is compared to other public buildings such as museums, galleries and libraries.
Table 43 shows energy intensity for Parliament House and DPS passenger vehicles.
Table 43: Energy intensity for Parliament House and passenger vehicles
|
Indicator
|
Energy intensity
|
|
2011–12
|
2012–13
|
2013–14
|
|
Parliament House building (MJ/m²)
|
912
|
930
|
892
|
|
Transport–passenger vehicles (MJ/km)
|
3.61
|
3.57
|
3.85
|
In 2013–14, Parliament House energy intensity reduced by 4.1 per cent compared with 2012–13 and plateaued. It has, however, remained below the average trending energy intensity of public buildings in Australia.
Figure 19 shows annual energy intensity of Parliament House since 2008–09 and average trending energy intensity of public buildings.
Passenger vehicle energy intensity increased slightly in 2013–14 compared with the previous year due to the addition of larger fleet vehicles and a reduction in E10 biofuel purchased.
Figure 19: Annual energy intensity (MJ/m²) of Parliament House and average trending energy intensity of public buildings1
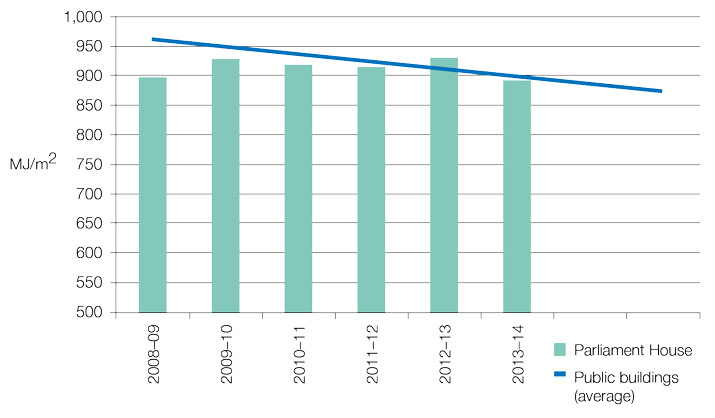
1. Public buildings energy trends sourced from report ‘Baseline Energy Consumption and Greenhouse Gas Emissions in Commercial Building in Australia: (November 2012).
Transport energy use
In 2013–14, there was a 50 per cent reduction in transport energy use compared with 2012–13. This is due to fewer vehicles being leased. Other transport energy consists of fuel used in DPS maintenance and loading dock vehicles, many of which, however, operate on electric power to reduce emissions.
Energy-saving initiatives
In 2013–14, no major energy reduction projects were undertaken at Parliament House due to ongoing fiscal constraints. However, DPS has continued to achieve energy savings through ongoing maintenance programs, office refurbishments, and IT software upgrades.
In 2013–14, measures that contributed to energy savings included:
- upgrade of 500 lights to a more energy efficient light type
- further optimisation of new chillers to improve performance
- upgrade of kitchens incorporating energy efficient equipment and utilising waste heat to heat the swimming pool
- review of the building’s heating and cooling equipment time-settings
- upgrade of IT desktop operating software with improved energy management.
Lighting
In 2013–14, DPS upgraded a number of the building’s lights to more energy efficient types, including:
- Parliament Budget Office—116 fluorescent lights were replaced and occupancy sensors were installed (the new fluorescent lights consume 60 per cent less energy than the old type)
- Cabinet Room—84 lights in the Cabinet Room and adjacent areas were upgraded to high efficiency LED lamps, representing an 85 per cent reduction in energy
- Members’ Guests Dining Room—192 lights were upgraded to high efficiency
LED lamps, representing an 85 per cent reduction in energy
- ground floor bathrooms and toilets—108 light fittings were upgraded to energy efficient LED type fittings, representing a 40 per cent reduction in energy.
With more than 35,000 luminaires installed throughout the site, DPS regularly reviews lighting efficiency opportunities through its in-house maintenance program, to reduce energy and operational costs while also considering building heritage and design integrity.
Heating and cooling equipment optimisation
The large chillers used for cooling the building are the single largest energy consuming items of equipment in the building. In 2010–11, three heavily utilised chillers were upgraded to a more efficient type, and in 2013–14, DPS performed further fine-tuning to improve their efficiency and maximise energy savings. This project has been a key contributor to the recent electricity savings achievements at Parliament House.
Building Monitoring System
The Building Monitoring System (BMS) at Parliament House is the prime tool for supervising and controlling the building’s vast energy and water consuming systems, comprising over 50,000 individual software points to manage heating and cooling, ventilation, lighting, hydraulics, security and life-support.
DPS has a dedicated team to oversee BMS functions, including implementing new strategies to reduce energy and water use in the building. In 2013–14, BMS staff started a trial of CO² air sensors connected to the air-conditioning that will fine-tune fresh-air volumes in the building and ensure that energy required for heating, cooling and ventilation is optimised.
In 2013–14, BMS staff conducted a comprehensive review of the building’s heating and cooling equipment time-settings. As a result, many equipment time parameters have been adjusted and optimised to prevent unnecessary energy wastage.
Building Condition Assessment
In 2014, DPS is delivering a comprehensive ‘Building Condition Assessment’ of Parliament House that will guide future maintenance activity, equipment replacement and upgrade strategies. A key component of the new strategies will be incorporating energy and water efficiency to improve building sustainability.
Sustainable transport
DPS provides bike storage, shower and change room facilities for people who cycle or walk to Parliament House and encourages bus travel through promotion of bus services and timetables in departmental newsletters. In 2013, DPS promoted the annual ‘Ride2Work’ day, and a number of building occupants joined other Parliamentary Triangle workers at a Ride2Work breakfast event at the National Library of Australia.
Recycling and waste management
Parliament House waste is generated from a diverse range of activities within the building. Quantities and types of waste fluctuate throughout the year depending on building occupancy, sitting patterns, construction projects, office refurbishments, and election reshuffles.
DPS provides facilities to recycle paper, cardboard, printer cartridges, lamps, used oil, grease, batteries, landscape material, metal, organic food waste and co-mingled waste.
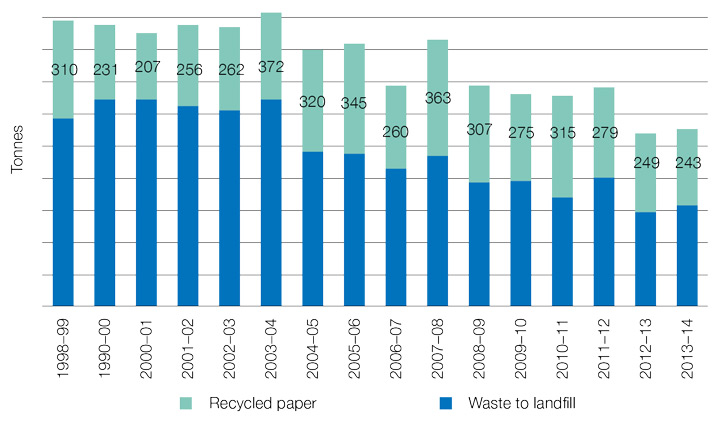
In 2013–14, the amount of general waste (excluding construction waste) sent to landfill was 311 tonnes. This is an increase of 6 per cent compared with the 293 tonnes sent in 2012–13. The increase was mainly due to a change of government that resulted in additional waste being generated during office reshuffles and clean-outs.
In 2013–14, a total of 243 tonnes of paper was recycled—a decrease of 2 per cent compared with the 249 tonnes in 2012–13. The amount of paper and cardboard recycled varies annually depending on purchasing requirements, parliamentary business and other building activity.
Construction waste is managed under project contracts and where possible and appropriate, construction materials are reused, recycled or disposed of in an environmentally friendly manner.
Figure 20: Annual waste disposed to landfill and paper recycled
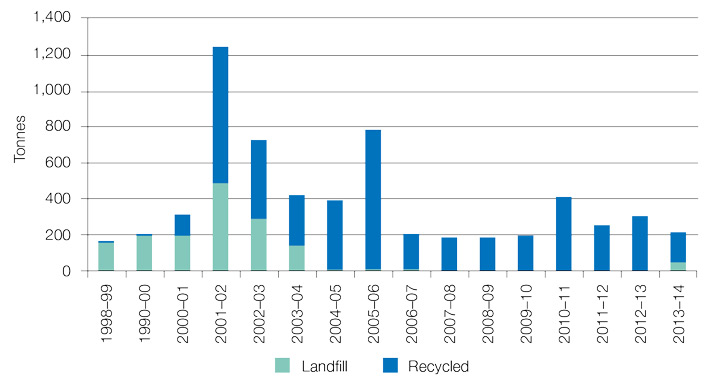
The preferred method for disposing of green landscape waste at Parliament House is to chip the material on site and re-use it in the gardens. When waste generated in the landscape cannot be chipped on site the material is taken off site to be recycled or sent to landfill. During 2013–14, 167 tonnes of landscape waste was sent for recycling and 48 tonnes of non-recyclable soil was sent to landfill.
Figure 21 shows annual trends in landscape waste and recycling rates.
Figure 21: Annual quantity of landscape waste (tonnes)
Co-mingled and organic waste recycling
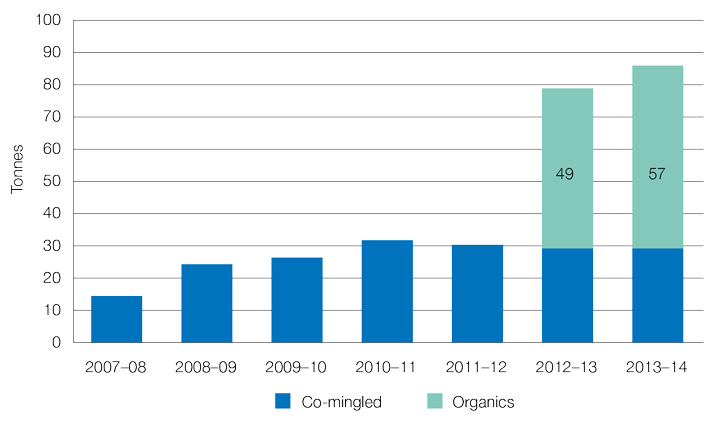
Co-mingled waste includes metal cans, glass bottles, milk cartons and plastic which are collected in a common bin. During 2013–14, a total of 29 tonnes of co-mingled waste was collected and recycled, which was equivalent to the amount collected in 2012–13.
DPS collects organic food waste from catering operations in the building for recycling at a local worm farm. Since being introduced in 2012, the initiative has helped reduce the burden on ACT landfill sites and reduce emissions (methane) caused by the breakdown of food waste.
During 2013–14, a total of 57 tonnes of organic waste was diverted from landfill and converted into garden compost material using the worm farm—an increase of 16 per cent on the 49 tonnes collected in 2012–13. Figure 22 illustrates annual co-mingled and organic recycling rates.
Figure 22: Annual co-mingled and organic waste recycled (tonnes)
Emissions and effluents
Greenhouse gas emissions
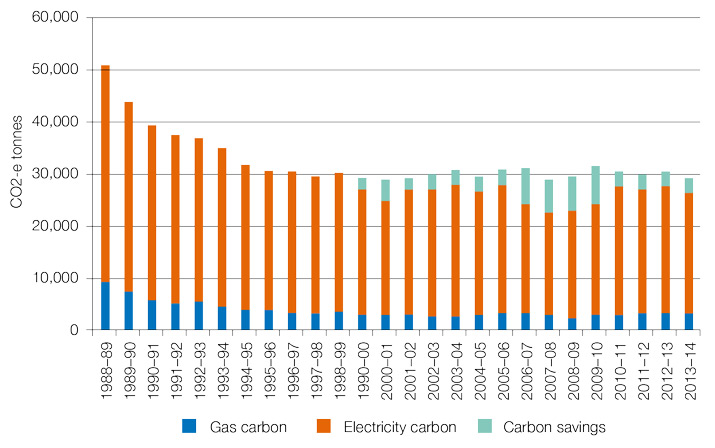
During 2013–14, a total of 26,554 tonnes of carbon dioxide equivalent (CO2-e) was generated from Parliament House operations, representing a 4 per cent decrease from 2012–13. Electricity and gas consumption at Parliament House comprised 99 per cent of total greenhouse gas emissions (26,487 tonnes CO2-e).
In 2013–14, greenhouse gas emission offsets included 2,590 tonnes CO2-e from 10 per cent accredited green power purchased through the whole-of-government electricity contract, and a further 65 tonnes CO2-e from clean electricity generated from the roof-top solar panels at Parliament House.
Table 49 shows the breakdown of emissions within various categories.
Table 49: Parliament House emissions (direct and indirect, including passenger and operational vehicle fleets)
|
Emission category
|
Comment
|
2011–12
(tonnes CO2e)
|
2012–13
(tonnes CO2e)
|
2013–14
(tonnes CO2e)
|
|
Scope 1
|
Emissions at the source of the activity (for example, emitted from gas and fuels used at Parliament House and by vehicles)
|
2,688
|
2,684
|
2,548
|
|
Scope 2
|
Emissions generated elsewhere (for example, by the power plants that produce the electricity used at Parliament House)
|
20,046
|
20,371
|
19,533
|
|
Scope 3
|
Indirect emissions, meaning emissions generated during the delivery of electricity, gas and fuel to Parliament House, over which DPS has little control
|
4,593
|
4,665
|
4,473
|
|
Scopes 1 and 2 total
|
DPS has direct responsibility for these emissions
|
22,734
|
23,055
|
22,081
|
|
Total net emissions (Scopes 1,
2 and 3)
|
Direct and indirect emissions including offsets
|
27,327
|
27,720
|
26,554
|
Figure 23 shows annual greenhouse gas emissions since Parliament House opened in 1988.
Figure 23: Annual greenhouse gas emissions from electricity and gas, and carbon savings from purchase of accredited green power and on-site solar panels.
Emission reductions from recycling
In 2013–14, DPS diverted 57 tonnes of organic food waste from landfill to a local recycling facility—equivalent to reducing lifetime landfill CO2 emissions by 91 tonnes.1
Ozone-depleting substances
Parliament House uses refrigerants that contain ozone-depleting substances. These are used for chillers, cool rooms and refrigerators. DPS is reducing the requirement for ozone-depleting gases through timely replacement of older equipment with equipment that uses environmentally safer refrigerants.
In 2013–14, DPS reduced the total refrigerants purchased by 44 per cent compared to the previous year. All refrigerants purchased were free of ozone depleting substances.
Air pollutants
The combustion of natural gas at Parliament House for heating, hot water and cooking purposes generates oxides of nitrogen (NOx), oxides of sulphur (SOx) and other air pollutants. DPS reports annually on these emissions to the National Pollution Inventory (www.npi.gov.au). In 2013–14, air pollutants from Parliament House decreased in line with a reduction in natural gas consumed—a 3.5 per cent reduction compared with the previous year. Table 45 lists annual emissions of air pollutants.
1. Conversion factor equals 1.6 tonnes CO2 per ton of solid food waste—National Greenhouse Accounts (NGA) Factors (2013–14).
Table 45: Annual emissions of air pollutants and particulates
|
Air pollutants
|
2011–12 (kg)
|
2012–13 (kg)
|
2013–14 (kg)
|
|
Carbon monoxide
|
2,009
|
2,057
|
1,984
|
|
Oxides of nitrogen
|
2,389
|
2,448
|
2,358
|
|
Particulate matter (PM10)
|
177
|
181
|
175
|
|
Particulate matter (PM2.5)
|
176
|
180
|
174
|
|
Total volatile organic compounds
|
131
|
134
|
130
|
|
Sulphur dioxide
|
26
|
27
|
26
|
|
Polycyclic aromatic hydrocarbons
|
<1(0.015)
|
<1(0.016)
|
<1(0.015)
|
Discharges to water
Sewage from Parliament House is required, under a trade waste agreement, to be equivalent to domestic strength (a domestic equivalent is a concentration or level the same as would be found in household waste water). To ensure these requirements are met, the following facilities are in place:
- a grease trap on each kitchen drain
- a coalescing plate filter on the vehicle wash-down bay (to prevent oil from entering the sewer)
- a system to remove paint solids from paint brush washing facilities before they enter the sewer.
Significant spills of chemicals, oils and fuels
In 2013–14, there were no significant spills of chemicals, oils or fuels from Parliament House.
Appendix 3
Advertising and market research
In accordance with Section 311A of the Commonwealth Electoral Act 1918, DPS annually reports expenditure on advertising and market research. Expenditure by DPS in 2013–14 was as follows:
Table 46: Advertising costs
|
Supplier
|
Description
|
Cost (GST exclusive)
|
|
Universal McCann
|
Media placement
|
$19,812.59
|
|
Adcorp
|
Recruitment advertising
|
$14,780.57
|
During 2013–14, DPS did not conduct any advertising campaigns.
Appendix 4
Legal services expenditure
This is a statement of legal services expenditure by the Department of Parliamentary Services for 2013–14, published in compliance with paragraph 11.1 (ba) of the Legal Services Directions 2005.
Table 47: Legal services expenditure 2013–14
|
Description
|
Cost (excluding GST)
|
|
Total legal services expenditure
|
$543,621.38
|
|
Total internal legal services expenditure
|
$368,765.00
|
|
Total external legal services expenditure
|
$174,856.38
|
Appendix 5
Disability reporting
Since 1994, Commonwealth departments and agencies have reported on their performance as policy adviser, purchaser, employer, regulator and provider under the Commonwealth Disability Strategy.
In 2007–08, reporting on the employer role was transferred to the Australian Public Service Commission’s State of the Service Report and the APS Statistical Bulletin. These reports are available at www.apsc.gov.au. From 2010–11, departments and agencies have no longer been required to report on these functions.
The Commonwealth Disability Strategy has been overtaken by the National Disability Strategy 2010–2020, which sets out a ten year national policy framework to improve the lives of people with disability, promote participation and create a more inclusive society. A high level two-yearly report will track progress against each of the six outcome areas of the strategy and present a picture of how people with disability are faring. The first of these reports will be available in late 2014, and can be found at www.dss.gov.au.
Appendix 6
Correction of material errors in previous annual report
Page 54, Figure 6
The figure for ‘Hours on commissioned services for Senators and Members’ was incorrectly reported as 30,537 for 2012–13 in the 2012–13 Annual Report. The correct figure is 26,834.
Page 56, Table 4.4
The vendor-provided data for ‘Use of the Library’s collection and databases’ has been reassessed by the Parliamentary Library and duplication removed. The figure for 2012–13 was reported as 3.29m in the 2012–13 Annual Report. The correct figure is 3.20m.
Page 58, Figure 4.6
The figure for ‘New titles (books and serials) added to the Library’s catalogue’ within timeliness service standard for 2012–13 was incorrectly reported as 72 per cent in the 2012–13 Annual Report. The correct percentage is 78 per cent.
Page 58, 4.6
The percentage for ‘New items added to the Library’s Electronic Media Monitoring Service and the ParlInfo newspaper clippings database’ within the timeliness service standard target for 2012–13 was incorrectly reported as 95 per cent in the 2012–13 Annual Report. The correct percentage is 96 per cent.
Page 182
The number of errors in Hansard transcripts is normally measured per 100 pages. In the 2012–13 Annual Report, the number of errors was measured per single page, which resulted in an incorrect result being recorded in the performance information table. The correctly calculated figures appear below.
Hansard—Accuracy
|
Accuracy
|
|
Type of transcription
|
Service standard
|
Error rate
|
|
2011–12
|
2012–13
|
2013–14
|
|
Chamber proceedings
|
5 or less errors per 100 pages transcribed
|
2.9 errors
|
4.4 errors
|
2.5 errors
|
|
Committee hearings (Parliament House and interstate)
|
5 or less errors per 100 pages transcribed
|
11 errors
|
9.3 errors
|
7.4 errors
|