Report on performance
Program 1—Library services
Introduction
Program 1 aims to provide an effective knowledge centre for the Parliament through the provision of information, analysis and advice. These services are provided through two subprograms:
- subprogram 1.1—Research services. These services include responding to requests from individual parliamentary clients for information and research, and the production of general distribution briefs and publications; and
- subprogram 1.2—Information access services. Information services are provided to the Library’s clients by acquiring and providing access to information resources, through the selection, processing and indexing of material for library and media databases in ParlInfo, and by publishing print and electronic works.
Performance is assessed using indicators that cover quality, quantity and price. Indicators, performance results and relevant comments are shown against each of the subprograms.
Research services—subprogram 1.1
Table 4.1 quantifies the performance of research services.
Client requests
During 2011–12, consistent with previous years, all of the Library’s primary clients (Senators’ and Members’ offices, including Ministers’ offices) used the client request service at least once—exceeding the target of 98%.
There was a significant increase in the number of direct client requests—approximately 12 %—compared to the previous year.
General briefs and publications
In 2011–12, the Library produced 427 publications, a significant increase over previous years. This increase is primarily due to the implementation of the Parliamentary Library blog, FlagPost. A total of 158 blogs were written and posted in the financial year. The blogs are short timely analytic works which provide clients with up-to-date information on a current topic. Blog posts undergo a review process and are approved for release by senior Library staff.
The Library published 178 Bills Digests, eight of which were for Private Senators’ and Members’ Bills.
Hours spent on publications and on responding to enquiries placed directly by Senators and Members and their staff decreased from the previous year, in part reflecting changing staff numbers. However, hours on client services to parliamentary committees, parliamentary departments and reciprocal arrangements increased by approximately 36%.
Client training and seminars
Parliamentary Library Lectures and Vital Issues Seminars attracted over 360 attendees in 2011 12. The aim of the seminar program, which has been running since 1986, is to bring notable speakers to the Parliament to give Senators and Members and their staff the opportunity to hear, first hand, expert opinion on a range of currently relevant topics. Speakers in 2011–12 covered a diverse range of topics, including: the Cost of Living in Australia; the US Presidential Election; the Australia US alliance in the 21st Century; tax reform; and human trafficking and slavery. Seminar recordings are available on the APH website.
Table 4.1—Research services—subprogram 1.1—deliverables
|
Deliverable
|
Measure
|
Performance
|
|
|
|
2009–10
|
2010–11
|
2011–12
|
|
Individual client requests
|
Percentage of primary clients (Senators’ and Members’ offices and Ministers’ offices) using the services (target: 98%)
|
100%
|
100%
|
100%
|
| |
Number of individual client requests (target: 16,000)
|
15,476
|
13,818
|
15,460
|
|
Self-service requests
|
Number of online uses of the Parliamentary Library’s publications, including the Parliamentary Handbook and General Briefs and Publications, through ParlInfo and the Internet (target: 6,000,000)
|
5.56m13
|
6.95m14
|
4.8m15
|
|
General briefs and publications
|
Number of general briefs and publications prosuced (target: 220)
|
285
|
361
|
427
|
|
Client training and seminars
|
Attendance at training courses and events (eg Vital Issues seminars) (target: 500 attendees).
|
550
|
508
|
589
|
Client satisfaction with requests and general briefs and publications (GBPs)
Table 4.2 shows the level of satisfaction with research services.
The Library received a complaint from one client regarding delayed publication of a Bills Digest. The Library responded to the complaint, apologising and noting the impact of increasing resource constraints.
Client satisfaction with the Library’s service in the 43rd Parliament is 93%, up from 89% in the 2007 survey. Of these, 80% were ‘extremely satisfied’ or ‘very satisfied’.
Performance against the timeliness target fell below the target of 95%. This reflected in part the increase of some 12% in the number of individual client requests from the previous year and resourcing pressures caused by reduced staff numbers. Some part of this variation is explainable as record-keeping errors during the implementation phase of a new recording system for client inquiries.
Table 4.3 shows the cost of research services.
Figure 8—Distribution of client service hours by service type
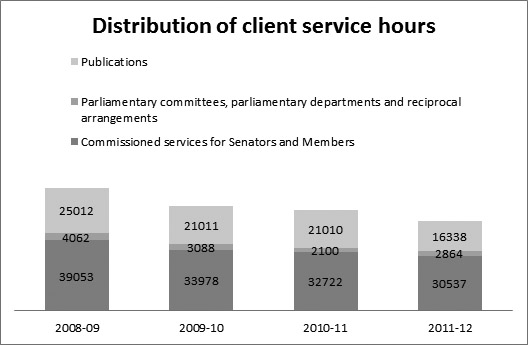
Text version of Figure 8
Table 4.2—Research services—subprogram 1.1—key performance indicators
|
Key performance Indicator
|
Measure
|
Performance
|
|
|
|
2009–10
|
2010–11
|
2011–12
|
|
Client satisfaction with requests and general briefs and publications (GBPs)
|
High level of customer satisfaction (target: 90%)
|
93%
|
93%
|
93%
|
| |
Client service delivered to timeliness service standard (target: 95%)
|
96%
|
97%
|
88%
|
| |
Number of complaints from clients
|
0
|
2
|
1
|
Table 4.3—Research services—subprogram 1.1—price indicators
|
Deliverable
|
Measure
|
Performance
|
|
|
|
2009–10
|
2010–11
|
2011–12
|
|
Cost of research services
|
Average cost per individual client request
|
$442
|
$495
|
$426
|
| |
Average direct cost per self-service client request (staff time only)
|
$0.61
|
$0.49
|
$0.68
|
| |
Total cost of subprogram 1.1
|
$12.16m
|
$12.15m
|
$11.582m
|
Information access services—subprogram 1.2
The services contributing to this subprogram include:
- the Library collection;
- online full text content such as news clippings;
- media services—desktop access to television and radio;
- commercial databases; and
- client services.
Table 4.4 shows the level of performance of information access services
Table 4.4—Information access services—subprogram 1.2—deliverables
|
Deliverable
|
Measure
|
Performance
|
|
|
|
2009–10
|
2010–11
|
2011–12
|
|
Material added to Library databases
|
Number of items added to the Library’s Electronic Media Monitoring Service and to ParlInfo Search databases (target: 140,000)
|
161,203
|
191,430
|
185,600
|
|
Material added to Library collection
|
Number of new titles (books and serials) added to the Library’s catalogue (target: 4,200).
|
4,275
|
4,270
|
4,652
|
|
Percentage of titles (books and serials) in Library’s collection available to clients online in full text (target: 32%).
|
26%
|
31%
|
33%
|
|
Use of the Library collection and databases
|
Use of the collections and databases, including loans from the collection, radio and television programs from the Electronic Media Monitoring Service, and from ParlInfo databases (target: 3,800,000 searches)
|
4.45m16
|
3.17m17
|
3.48m
|
Material added to Library databases
The target for the number of items added to the Library’s Electronic Media Monitoring Service and to Library databases in ParlInfo was 140,000 and this was exceeded as 185,600 items were added. In 2011–12, the 43rd Parliament generated a large volume of media commentary and this content was harvested by the Library and is reflected in this statistic.
Material added to Library collection
The target number of new titles (books and serials) added to the Library’s catalogue was 4,200 and this was exceeded with 4,650 items being added.
The percentage of titles available online (full text) increased from 31% to 33%.
Use of the Library’s collection and databases
The target figure of 3,800,000 uses of the Library’s collection and databases was not met with 3,480,000 uses being reported.
Electronic media monitoring service
The electronic media monitoring service (EMMS) has been in use in its current iteration since 2004. Throughout 2011–12, work continued on moving the existing EMMS to a new platform that will be easier for clients to use.
Table 4.5 shows the level of satisfaction with information access services.
Client satisfaction with information access services
Client satisfaction with the Library’s service in the 43rd Parliament is 93%, up from 89% in the 2007 survey. Of these, 80% were ‘extremely satisfied’ or ‘very satisfied’.
The targets for timeliness in adding new items to the Library’s collections were not met. For the catalogue material, this is a direct result of the impact on a small team of unplanned and unavoidable staff absences combined with vacant positions that could not be filled rapidly. For the Electronic Media Monitoring Service and the ParlInfo newspaper clippings database, the problems arose from intermittent technical failures.
Table 4.6 shows the cost of information access services.
Table 4.5—Information access services—subprogram 1.2—key performance indicators
|
Key Performance Indicator
|
Measure
|
Performance
|
|
|
|
2009–10
|
2010–11
|
2011–12
|
|
Client satisfaction with information access services
|
High level of client satisfaction (target: 90%)
|
93%
|
93%
|
93%
|
| |
New titles (books and serials) added to the Library’s catalogue within timeliness service standard (target: 90%).
|
75%
|
70%
|
74%
|
| |
New items added to the Library’s Electronic Media Monitoring Service and the ParlInfo newspaper clippings database within timeliness service standard (target: 95%)
|
98.5%
|
88%
|
93%
|
| |
Number of complaints from clients
|
0
|
0
|
0
|
Table 4.6—Information access services—subprogram 1.2—price indicators
|
Deliverable
|
Measure
|
Performance
|
|
|
|
2009–10
|
2010–11
|
2011–12
|
|
Cost of information access services
|
Average cost per item added to the Library’s collection
|
$340
|
$209
|
$298
|
| |
Average cost per item added to the Library’s databases
|
$18.68
|
$14.61
|
$20.32
|
| |
Average cost per use of the Library’s databases and collection
|
$1.69
|
$2.37
|
$2.32
|
| |
Total cost of subprogram 1.2
|
$10.7m
|
$11.19m
|
$12.094m
|
Figure 9—Library organisational chart at 30 June 2012
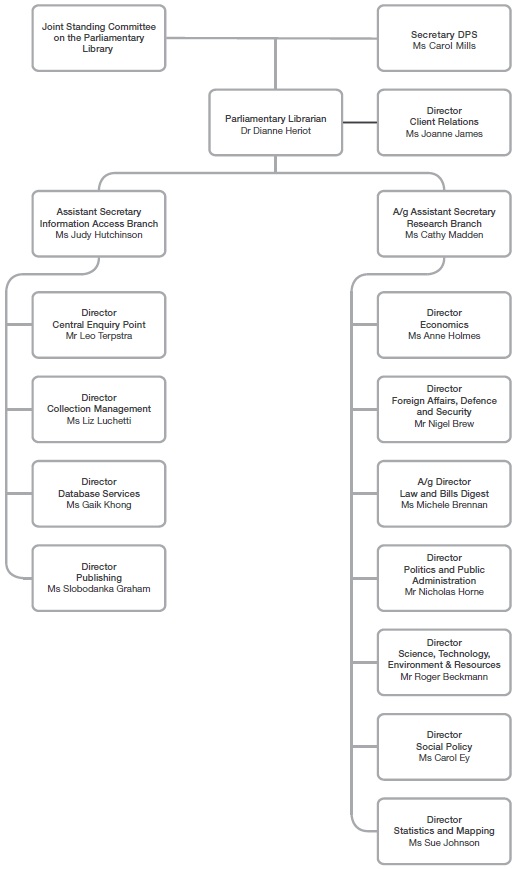
Text version of Figure 9
13. Denial of Service attack in February 2010 resulted in problems for the statistical reports on use of web services.
14. This statistic has been reviewed and corrected to include all self-help including more recently developed services.
15. The upgrade of the Parliament House website in February 2012 has changed how data is collected for this statistic.
16. A Denial of Service attack on ParlInfo Search resulted in problems for the statistical reports on use of web services for February and March 2010.
17. Issues with external user stats data in resulted in problems for the statistical reports in use of web services for November 2010, further problems occurred in March and April 2011.