4.1 Value of retail sales

| |
2011 |
2012 |
2013 |
2014 |
2015 |
| Value (a) – $ million |
|
|
|
|
|
| New South Wales |
76 515 |
78 478 |
81 717 |
88 626 |
93 258 |
| Victoria |
63 392 |
64 127 |
65 529 |
69 480 |
72 895 |
| Queensland |
50 989 |
53 440 |
55 898 |
57 616 |
59 360 |
| South Australia |
17 287 |
17 401 |
17 548 |
18 144 |
18 945 |
| Western Australia |
28 441 |
31 136 |
32 208 |
32 731 |
33 572 |
| Tasmania |
5 176 |
5 107 |
5 184 |
5 547 |
5 741 |
| Northern Territory |
2 761 |
2 871 |
2 952 |
3 078 |
3 081 |
| Australian Capital Territory |
4 578 |
4 760 |
4 949 |
4 987 |
5 200 |
| Australia |
249 138 |
257 319 |
265 985 |
280 209 |
292 052 |
| |
|
|
|
|
|
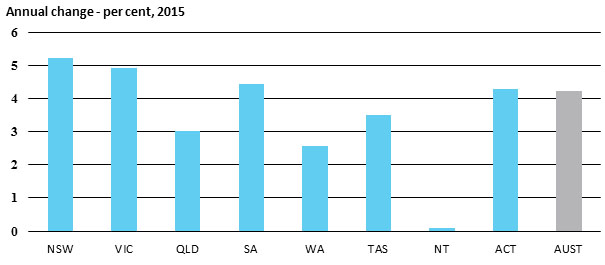
| Annual change – per cent |
|
|
|
|
|
| New South Wales |
1.4 |
2.6 |
4.1 |
8.5 |
5.2 |
| Victoria |
2.8 |
1.2 |
2.2 |
6.0 |
4.9 |
| Queensland |
3.2 |
4.8 |
4.6 |
3.1 |
3.0 |
| South Australia |
-0.7 |
0.7 |
0.8 |
3.4 |
4.4 |
| Western Australia |
7.7 |
9.5 |
3.4 |
1.6 |
2.6 |
| Tasmania |
-1.1 |
-1.3 |
1.5 |
7.0 |
3.5 |
| Northern Territory |
2.8 |
4.0 |
2.8 |
4.3 |
0.1 |
| Australian Capital Territory |
0.4 |
4.0 |
4.0 |
0.8 |
4.3 |
| Australia |
2.6 |
3.3 |
3.4 |
5.3 |
4.2 |
(a) Seasonally-adjusted data
Source: ABS, Retail Trade Australia, January 2016, cat. no. 8501.0
4.2 Passenger vehicle sales

| |
2011
|
2012
|
2013
|
2014
|
2015
|
| Number (a) |
|
|
|
|
|
| New South Wales |
182 547 |
185 080 |
181 248 |
176 060 |
176 714 |
| Victoria |
158 051 |
163 856 |
163 282 |
152 200 |
146 173 |
| Queensland |
105 126 |
107 664 |
105 113 |
98 380 |
98 821 |
| South Australia |
36 158 |
36 296 |
35 843 |
34 173 |
31 078 |
| Western Australia |
54 460 |
60 206 |
57 080 |
49 800 |
42 602 |
| Tasmania |
8 689 |
8 625 |
9 325 |
7 601 |
7 662 |
| Northern Territory |
4 195 |
4 320 |
4 226 |
3 917 |
3 585 |
| Australian Capital Territory |
10 296 |
10 808 |
10 337 |
9 471 |
9 048 |
| Australia |
559 522 |
576 855 |
566 454 |
531 602 |
515 683 |
| |
|
|
|
|
|
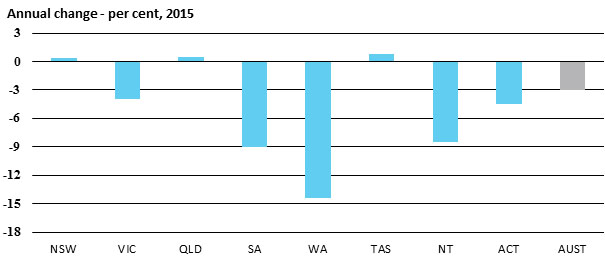
| Annual change – per cent |
|
|
|
|
|
| New South Wales |
-1.8 |
1.4 |
-2.1 |
-2.9 |
0.4 |
| Victoria |
-7.6 |
3.7 |
-0.4 |
-6.8 |
-4.0 |
| Queensland |
-3.7 |
2.4 |
-2.4 |
-6.4 |
0.4 |
| South Australia |
-5.9 |
0.4 |
-1.2 |
-4.7 |
-9.1 |
| Western Australia |
-12.2 |
10.6 |
-5.2 |
-12.8 |
-14.5 |
| Tasmania |
-17.1 |
-0.7 |
8.1 |
-18.5 |
0.8 |
| Northern Territory |
-2.7 |
3.0 |
-2.2 |
-7.3 |
-8.5 |
| Australian Capital Territory |
-4.0 |
5.0 |
-4.4 |
-8.4 |
-4.5 |
| Australia |
-5.5 |
3.1 |
-1.8 |
-6.2 |
-3.0 |
(a) Includes vehicles designed primarily
for the carriage of people, such as cars, station wagons and people movers.
Also includes four wheel drive passenger vehicles not classified as sports
utility vehicles.
Source: ABS, Sales of New Motor Vehicles, February 2016, cat. no. 9314.0
4.3 Dwelling approvals

| |
2011 |
2012 |
2013 |
2014 |
2015 |
| Number (a) |
|
|
|
|
|
| New South Wales |
34 433 |
38 418 |
48 349 |
54 167 |
67 788 |
| Victoria |
52 295 |
52 139 |
49 798 |
60 889 |
68 460 |
| Queensland |
27 664 |
28 722 |
35 330 |
39 395 |
49 675 |
| South Australia |
10 058 |
8 288 |
10 399 |
11 583 |
11 177 |
| Western Australia |
19 917 |
21 367 |
28 404 |
32 801 |
28 475 |
| Tasmania |
2 556 |
1 986 |
1 861 |
2 519 |
2 763 |
| Northern Territory |
1 322 |
1 920 |
2 306 |
2 000 |
1 666 |
| Australian Capital Territory |
5 510 |
3 794 |
4 801 |
3 938 |
4 202 |
| Australia |
153 755 |
156 634 |
181 248 |
207 292 |
234 206 |
| |
|
|
|
|
|
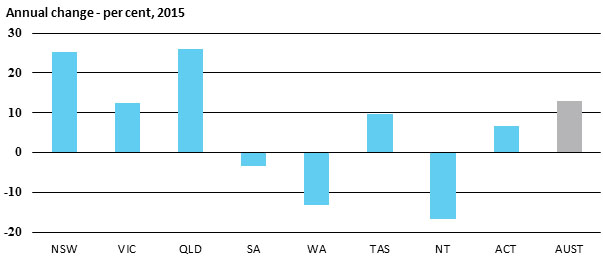
| Annual change – per cent |
|
|
|
|
|
| New South Wales |
-6.5 |
11.6 |
25.8 |
12.0 |
25.1 |
| Victoria |
-16.6 |
-0.3 |
-4.5 |
22.3 |
12.4 |
| Queensland |
-20.5 |
3.8 |
23.0 |
11.5 |
26.1 |
| South Australia |
-22.8 |
-17.6 |
25.5 |
11.4 |
-3.5 |
| Western Australia |
-17.7 |
7.3 |
32.9 |
15.5 |
-13.2 |
| Tasmania |
-20.1 |
-22.3 |
-6.3 |
35.4 |
9.7 |
| Northern Territory |
-22.1 |
45.2 |
20.1 |
-13.3 |
-16.7 |
| Australian Capital Territory |
1.0 |
-31.1 |
26.5 |
-18.0 |
6.7 |
| Australia |
-15.5 |
1.9 |
15.7 |
14.4 |
13.0 |
(a) Houses and other dwellings (e.g.
flats) intended for long-term residential use; includes both private and public
sector dwellings.
Source: ABS, Building Approvals, January 2016, cat. no. 8731.0
4.4 Business investment

| |
2010-11 |
2011-12 |
2012-13 |
2013-14 |
2014-15 |
|
Chain volume measures (a) – $
million
|
|
|
|
|
| New South Wales |
51 028 |
53 888 |
57 176 |
53 178 |
53 863 |
| Victoria |
41 950 |
42 458 |
37 698 |
40 925 |
43 685 |
| Queensland |
46 287 |
64 560 |
68 060 |
65 707 |
51 423 |
| South Australia |
11 211 |
12 532 |
12 507 |
12 229 |
12 336 |
| Western Australia |
51 096 |
74 257 |
78 714 |
71 232 |
62 471 |
| Tasmania |
2 645 |
2 961 |
2 433 |
2 382 |
2 510 |
| Northern Territory |
2 661 |
5 217 |
9 244 |
10 541 |
12 511 |
| Australian Capital Territory |
2 404 |
2 693 |
2 752 |
2 246 |
2 274 |
| Australia |
209 915 |
258 691 |
268 545 |
258 438 |
241 073 |
| |
|
|
|
|
|
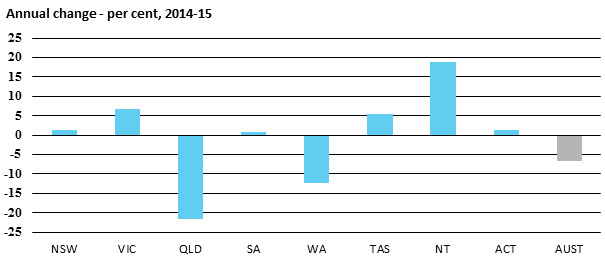
| Annual change – per cent |
|
|
|
|
|
| New South Wales |
5.7 |
5.6 |
6.1 |
-7.0 |
1.3 |
| Victoria |
1.5 |
1.2 |
-11.2 |
8.6 |
6.7 |
| Queensland |
22.1 |
39.5 |
5.4 |
-3.5 |
-21.7 |
| South Australia |
8.8 |
11.8 |
-0.2 |
-2.2 |
0.9 |
| Western Australia |
11.3 |
45.3 |
6.0 |
-9.5 |
-12.3 |
| Tasmania |
8.1 |
11.9 |
-17.8 |
-2.1 |
5.4 |
| Northern Territory |
-20.7 |
96.1 |
77.2 |
14.0 |
18.7 |
| Australian Capital Territory |
-2.4 |
12.0 |
2.2 |
-18.4 |
1.2 |
| Australia |
8.9 |
23.2 |
3.8 |
-3.8 |
-6.7 |
(a) Private business gross fixed capital formation for other buildings
and structures, machinery and equipment, livestock and intangible fixed assets.
Note: National account data is only available for financial years
Source: Australian National Accounts: State Accounts, 2014–15, cat. no.
5220.0
For copyright reasons some linked items are only available to members of Parliament.
© Commonwealth of Australia

Creative Commons
With the exception of the Commonwealth Coat of Arms, and to the extent that copyright subsists in a third party, this publication, its logo and front page design are licensed under a Creative Commons Attribution-NonCommercial-NoDerivs 3.0 Australia licence.
In essence, you are free to copy and communicate this work in its current form for all non-commercial purposes, as long as you attribute the work to the author and abide by the other licence terms. The work cannot be adapted or modified in any way. Content from this publication should be attributed in the following way: Author(s), Title of publication, Series Name and No, Publisher, Date.
To the extent that copyright subsists in third party quotes it remains with the original owner and permission may be required to reuse the material.
Inquiries regarding the licence and any use of the publication are welcome to webmanager@aph.gov.au.
This work has been prepared to support the work of the Australian Parliament using information available at the time of production. The views expressed do not reflect an official position of the Parliamentary Library, nor do they constitute professional legal opinion.
Any concerns or complaints should be directed to the Parliamentary Librarian. Parliamentary Library staff are available to discuss the contents of publications with Senators and Members and their staff. To access this service, clients may contact the author or the Library‘s Central Entry Point for referral.