The Australian Bureau of Statistics (ABS) provides monthly updates of labour force data, but what do these numbers mean and how are they interpreted? An earlier post provided background information on the Labour Force Survey. This article focuses on the key employment numbers and rates produced from that survey.
What are the key employment figures?
Headline figures released by the ABS include the number of employed people (workers) and the employment-to-population ratio (also referred to as the ‘employment rate’). Employment data is available by age, sex and regions, full-time and part-time workers, hours worked, occupation, industry and a range of other work characteristics.
Note that for most characteristics of employment, the details relate to a person’s main job. The main job is the one in which the most hours are usually worked.
Who is considered employed?
Through the Labour Force Survey, the ABS collects information on whether or not a person is employed. A person is asked about their work-related activities in a specific timeframe, generally the week prior to the survey. They are asked whether they have done any work in a job, business or farm. To be counted as employed, a person has to have done at least one hour of work for pay, profit, commission or payment in-kind. People who worked without pay in a family business or on a farm are also counted as employed, as are some people who were temporarily away from work. For more information see the Library’s publication, Employment statistics: a quick guide.
What is the ratio and how is it calculated?
As the name suggests, the employment-to-population ratio is the number of employed people expressed as a proportion of the civilian population (see related post for an explanation). The ratio tells you what part of a given population is employed. Across Australia, this figure generally sits somewhere above 60%, but there are variations across regions, age groups and sex, as well as across other demographics (e.g. families with children compared to singles, or couples without children).
The ABS usually publishes the ratio for people aged 15 years and over. However, it is sometimes more narrowly defined, with an upper age limit, or a different age range applied (such as for young people). As an example, the Department of Jobs and Small Business publishes the ‘employment rate’ for people aged 15 to 64 years on the dashboard of their Labour Market Information Portal (see ‘ABS Labour Force Regions – SA4 data’).
How are jobs counted?
In general, the ABS does not provide a count of jobs. The change in employment level from one period to the next is often mistakenly referred to as the ‘number of jobs created’ (or lost). However, the employment figures relate to a change in the number of employed people. For example, in April 2018 there were around 12.5 million employed people compared to 12.1 million employed people in April 2017 (trend figures). This change represents an increase of about 355,200 employed people over the 12 month period.
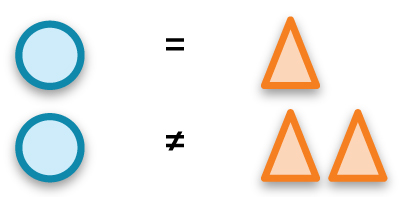
The ABS counts each employed person once, regardless of how many jobs that person holds. About 6% of all employed people hold more than one job. The diagram below provides a quick visualisation of this concept. For more information see the FlagPost, ‘Employed people or jobs: semantics or an important difference in terminology?’
Employed person Jobs held (one or more)

Experimental estimates of the number of jobs held have been produced by the ABS for 2015–16 and are available from Labour Account Australia, July 2017. The estimate of jobs includes second and subsequent jobs held by employed people. The figures are compiled using data from various sources and, while the ABS has indicated they plan to update the series, the estimates are not currently available on a regular basis.
What does growth look like?
Employment growth can be measured in a number of different ways. Generally, the number of employed for an earlier period is deducted from the number of employed in a more recent period and then expressed as a per cent. Using the previous example of change in employment from April 2017 to April 2018, annual growth would be 2.9%, with the calculation being:
Sum (12,505,200 minus 12,150,000) divided by 12,150,000 multiplied by 100.
Over this period however, the population is likely to have changed, so it’s worth checking whether employment increased as a result of natural growth, or whether the growth is actual expansion. This is where the ratio becomes useful. It can be used to assess whether there has been any real change in the level of employment. Using the same example and time points, at April 2018 the ratio was 62.0%, whereas for the period one year earlier the ratio was 61.2%. While small, this difference represents an increase of 0.8 of a percentage point.
How can I find out about underemployment?
The ABS publishes a number of underutilisation measures, including the underemployment rate, underutilisation rate and extended underutilisation rate (annual only). More information on this theme is available from the Library’s publication, Underemployment statistics: a quick guide.
For more information
Clients of the Parliamentary Library can request assistance to interpret ABS statistics, navigate the ABS website or find relevant ABS surveys and products by contacting the Statistics and Mapping Section via Library Enquiries.