Number of diagnostic imaging units and lag times around Australia
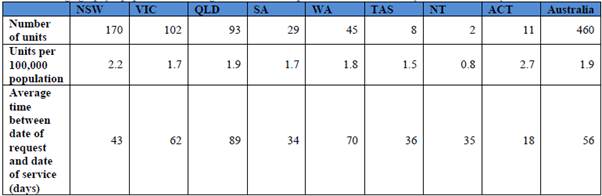
Ultrasound
Table
1: Ultrasound equipment and average time between request and date of service by
state and territory, 2015–16
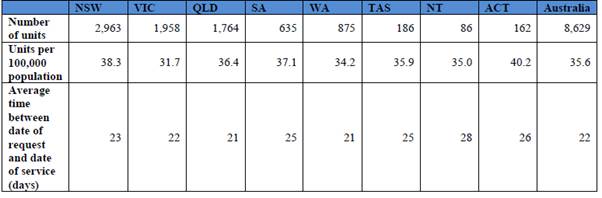
Source: Department of Health
(Department), Submission 18, p. 13.
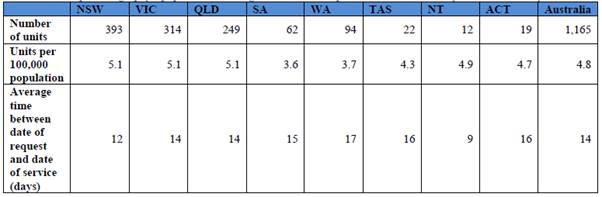
Computed tomography (CT)
Table
2: CT equipment and average time between request and date of service by state
and territory, 2015–16
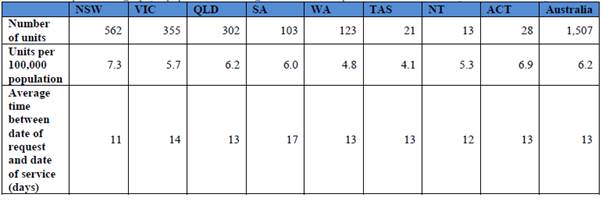
Source: Department, Submission
18, p. 13.
Diagnostic Radiology (x-ray, fluoroscopy, angiography, orthopantomography
and mammography)
Table
3: General x-ray equipment and average time between request and date of service
by state and territory, 2015–16
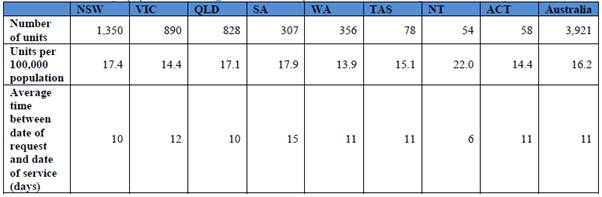
Source: Department, Submission
18, p. 14.
Table
4: Fluoroscopy equipment and average time between request and date of service
by state and territory, 2015–16
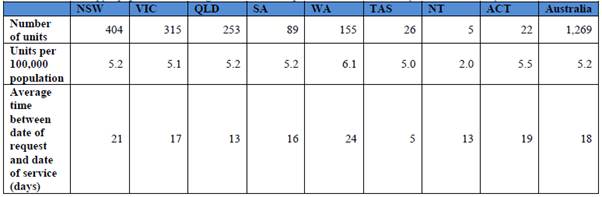
Source: Department, Submission
18, p. 14.
Table
5: Angiography equipment and average time between request and date of service
by state and territory, 2015–16
Source: Department, Submission
18, p. 15.
Table
6: Orthopantomography equipment and average time between request and date of
service by state and territory, 2015–16
Source: Department, Submission
18, p. 15.
Table 7: Mammography equipment and average time between
request and date of service by state and territory, 2015–16
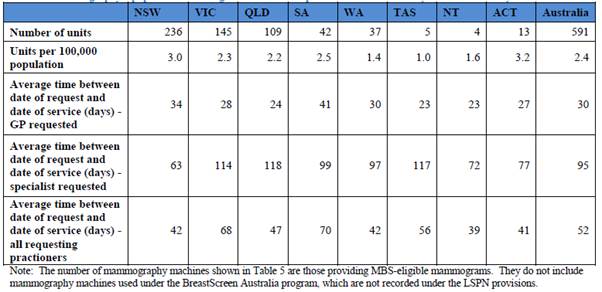
Source: Department, Submission
18, p. 14.
Nuclear medicine imaging equipment
Table
8: Nuclear medicine imaging equipment (other than PET) and average time between
request and date of service by state and territory, 2015–16
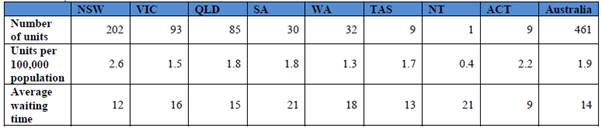
Source: Department, Submission
18, p. 15.
Positron emission tomography (PET)
Table
9: PET equipment and average time between request and date of service by state
and territory, 2015–16
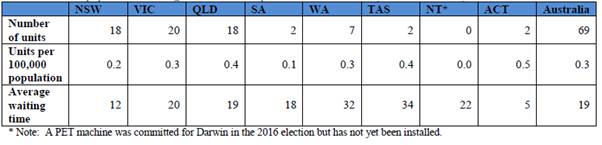
Source: Department, Submission
18, p. 15.
Magnetic Resonance Imaging (MRI)
Table
10: MRI – average lag time between request and date of service by state and
territory 2015–16
Source: Department, Submission
18, p. 16.
Navigation: Previous Page | Contents