Phillip Hawkins, Patrick Nykiel
This brief
provides an overview of the key fiscal and economic numbers from the 2017–18
Budget.
The 2017–18 Budget reaffirms a plan by the Australian
Government to return the Budget to balance in the 2020–21 fiscal year and
remain in surplus over the medium term.[1]
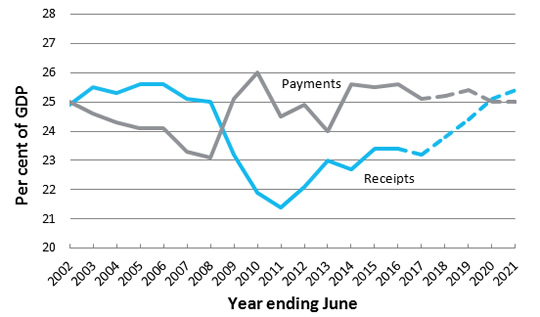
Achieving this surplus depends on closing the gap between
payments and receipts. The Budget papers show that this will predominately be
achieved by increasing receipts (Fig 2). Over the next four years, total Government
receipts are forecast to grow by around 6.7 per cent per annum from 23.8 per
cent of GDP in 2017–18 to 25.5 per cent of GDP in 2020–21. New measures
announced in this Budget are expected to add around $23.0 billion to revenue
over this period.
Over the same period, total payments are expected to grow at
around 4.2 per cent per annum (in nominal terms), declining slightly from 25.2
per cent of GDP in 2017–18 to 25 per cent of GDP in 2020‑21. New measures
announced in this Budget are expected to add $17.4 billion to expenses over the
five years to 2020–21.
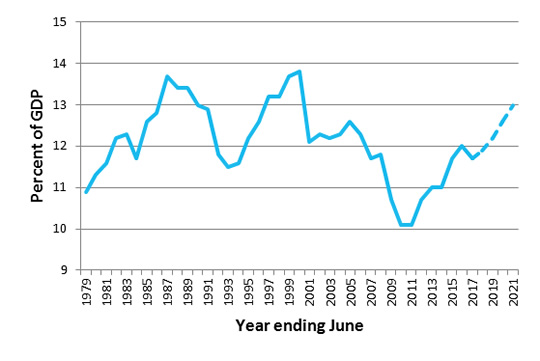
Most of the revenue increases in the budget are related to personal
income taxes,[2] which make up just under
half of all government receipts. These are expected to grow to their highest
level as a share of GDP since 1999–2000 (Fig 4). The growth in personal income
tax is being driven predominately by an increase in the Medicare Levy (which is
estimated to add $8.2 billion to tax revenues over the next four years) and
strong wages growth.[3]
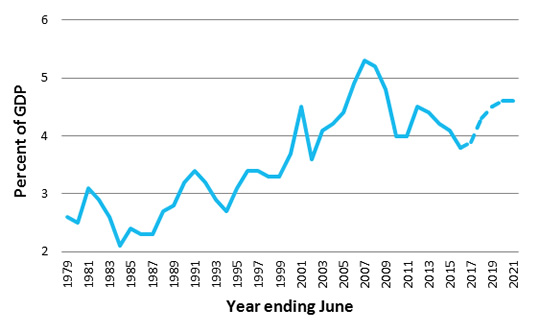
Company tax receipts[4] are also forecast to grow
strongly over the next four years, to their highest level since 2008–09, on the
back of improved corporate profitability and higher than previously forecast
commodity prices (Fig 5).[5]
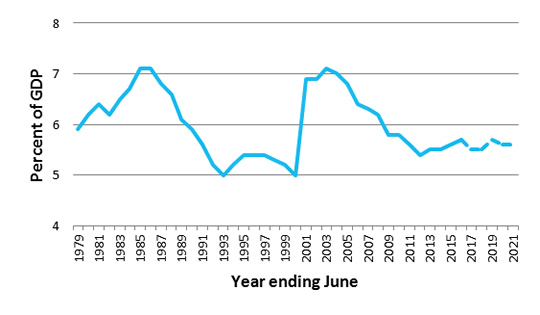
In contrast, sales taxes,[6] excise and customs duties
are not expected to change significantly over the next four years, remaining
around their lowest share of GDP since the GST was introduced in 2000 (Fig 6). As
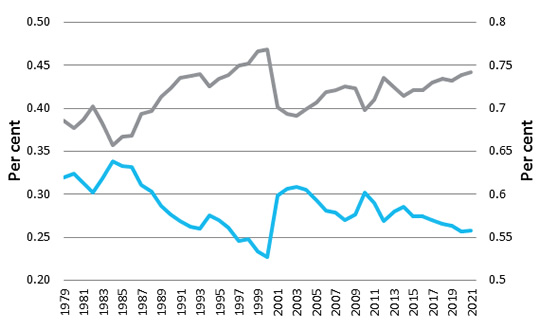
a result, indirect taxes are expected to fall to their lowest share of total
revenue since the GST was introduced (Fig 7).
Underlying these improved revenue forecasts are improvements
in a number of key macroeconomic parameters. By 2020–21, wages growth is
forecast to increase to its highest annual growth rate since 2010–11 (Fig 14)
and unemployment is expected to fall to its lowest level since 2011–12. Real
GDP growth is expected to improve from 1.75 per cent in 2016–17 to 3 per cent from
2018–19, around its 20 year average.
A number of commentators have highlighted uncertainties in
these economic forecasts, and the Budget itself notes the sensitivity of
taxation receipts to these underlying parameters. For a more detailed
discussion of this see the Budget briefing paper Assessment of key economic
parameters.
The Budget papers also reference a number of international
economic risks that could have potential impacts on the Budget’s economic
forecasts, many of which the Parliamentary Library highlighted in its Pre-Budget
Snapshot of the Australian Economy.[7]
The headline fiscal numbers
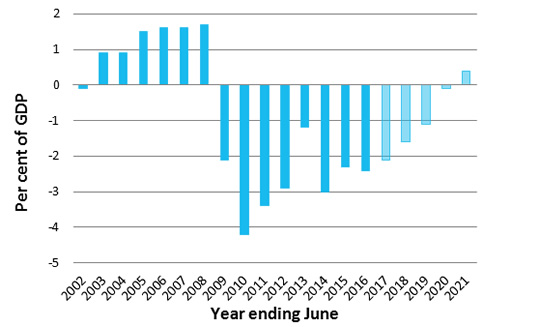
- the underlying cash deficit is estimated to be
$29.4 billion (-1.6 per cent of gross domestic product (GDP)) in
2017–18 and $21.4 billion (-1.1 per cent of GDP) in 2018–19 before
improving to a projected underlying cash surplus of $7.4 billion
(0.4 per cent of GDP) in 2020–21
- over the four years to 2020–21 accumulated net deficits
are estimated to total $45.9 billion
- total general government sector receipts are estimated to
be $433.5 billion (23.8 per cent of GDP) in 2017–18,
$462.5 billion (24.4 per cent of GDP) in 2018–19 rising to a
projected $526.3 billion (25.4 per cent of GDP) by 2020–21
- tax receipts are estimated to be $404.3 billion
(22.2 per cent of GDP) in 2017–18, $430.7 billion
(22.8 per cent of GDP) in 2018–19 increasing to a projected
$492.5 billion (23.7 per cent of GDP) by 2020–21
- The
largest component of tax receipts is personal income taxes which are
estimated to be $217.4 billion (11.9 per cent of GDP) in 2017–18, $230.8
billion (12.2 per cent of GDP) in 2018–19 increasing to a projected $270.2
billion (13 per cent of GDP) in 2020–21.
- general government sector payments are estimated to be $459.7
billion (25.2 per cent of GDP) in 2017–18, $480.4 billion (25.4 per cent
of GDP) in 2018–19 and increasing to a projected $518.9 billion (25.0 per cent
of GDP) by 2020–21
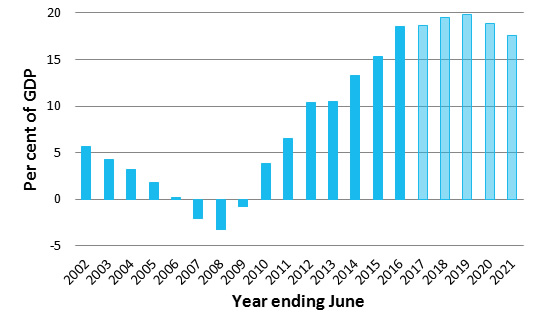
- general government sector net debt is estimated to be
$354.9 billion (19.5 per cent of GDP) in 2017–18, $375.1 billion
(19.8 per cent of GDP) in 2018–19 declining to a projected $366.2 billion
(17.6 per cent of GDP) by 2019–20
- general government sector net interest payments are
estimated to be $13.4 billion (0.7 per cent of GDP) in 2017–18,
$13.7 billion (0.7 per cent of GDP) in 2018–19 increasing to a
projected $15.5 billion (0.7 per cent of GDP) in 2020–21
- the face value of Commonwealth Government Securities (CGS)
on issue is estimated to be $540.0 billion in 2017–18, $582.0 billion in
2018–19 rising to $606.0 billion in 2020–21. Looking further out the total
value of CGS on issue is projected to rise to $725.0 billion by 2027–28.
The
Budget deficit is forecast to gradually
improve from a $29.4 billion deficit
in
2017–18 to a $7.4 billion surplus in 2019–20.
Underlying
Cash Balance
| Year |
$m |
% GDP |
| 2015–16 |
-39,606 |
-2.4 |
| 2016–17 |
-37,600 |
-2.1 |
| 2017–18 |
-29,396 |
-1.6 |
| 2018–19 |
-21,422 |
-1.1 |
| 2019–20 |
-2,470 |
-0.1 |
| 2020–21 |
7,417 |
0.4 |
|
Figure
1: Underlying Cash Balance % GDP
Source: Australian
Government, Budget strategy and outlook: budget paper no. 1:
2017–18, Statement 11:
historical Australian government data, Table 1, p. 11-6.
|
|
Achieving a surplus depends
on closing the gap between payments and receipts...
- in the last decade payments peaked at 26.0 per cent of GDP in
2009–10 and are estimated to be 25.5 per cent of GDP in 2018–19 before
declining to 25.0 per cent in 2020–21
- in the last decade receipts bottomed at 21.4 per cent of GDP in
2010–11 and are forecast to be 23.8 per cent of GDP in 2017–18 and increase
to 25.4 per cent of GDP in 2020–21.
|
Figure
2: Receipts and Payments % GDP
Source: Australian
Government, Budget strategy and outlook: budget paper no. 1:
2017–18, 2017, Statement 11: historical Australian
government data, Table 1, p. 11-6.
|
|
Net debt is forecast to peak as
a percentage of GDP (19.8 per cent) in 2018–19.
Net
Debt
| Year |
$m |
%
GDP |
| 2015–16 |
305,454 |
18.5 |
| 2016–17 |
325,091 |
18.6 |
| 2017–18 |
354,931 |
19.5 |
| 2018–19 |
375,112 |
19.8 |
| 2019–20 |
374,715 |
18.9 |
| 2020-21 |
366,169 |
17.6 |
|
Figure
3: Net Debt % GDP
Source: Australian
Government, Budget strategy and outlook: budget paper no. 1:
2017–18, 2017, Statement 11: historical Australian
government data, Table 4, p. 11-12.
|
|
Total personal income tax
receipts are projected to grow to 12.2 per cent of GDP in 2020–21, their
highest level since 2000
Individuals and other
tax receipts
| Year |
$m |
%
GDP |
| 2015–16 |
198,303 |
12.0 |
| 2016–17 |
205,990 |
11.7 |
| 2017–18 |
217,400
|
11.9 |
| 2018–19 |
230,790 |
12.2 |
| 2019–20 |
250,840 |
12.6 |
| 2020–21 |
270,200 |
13.0 |
|
Figure
4: Personal income tax % GDP
Source:
Australian Government, Budget strategy and outlook: budget paper no. 1:
2017–18, Statement 5: revenue, online supplementary tables.
|
|
Company income taxes are
projected to grow to 4.6 per cent of GDP in 2020–21,around their highest
level since 2008–09
Company tax receipts
| Year |
$m |
%
GDP |
| 2015–16 |
63,638 |
3.8 |
| 2016–17 |
68,800 |
4.0 |
| 2017–18 |
78,800
|
4.4 |
| 2018–19 |
85,600 |
4.6 |
| 2019–20 |
92,600 |
4.7 |
| 2020–21 |
96,000 |
4.6 |
|
Figure
5: Company Tax % GDP
Source: Australian Government, Budget strategy and outlook: budget paper no. 1:
2017–18, 2017, Statement 5: revenue, online supplementary
tables.
|
|
Sales tax (including GST),
excise and customs duties are projected to be 5.6 per cent in 2020–21, close
to their lowest level since 2000
Sales tax, excise and
customs duty
| Year |
$m |
%
GDP |
| 2015–16 |
94,337 |
5.7 |
| 2016–17 |
96,584 |
5.5 |
| 2017–18 |
100,978
|
5.5 |
| 2018–19 |
106,301 |
5.7 |
| 2019–20 |
111,355 |
5.6 |
| 2020–21 |
117,643 |
5.6 |
|
Figure
6: Sales (incl GST), Excise and Customs Taxes % GDP
Source:
Australian Government, Budget strategy and outlook: budget paper no. 1:
2017–18, 2017, Statement 5: revenue, online supplementary
tables.
|
|
Indirect taxes are
projected to fall to their lowest proportion of total receipts since
1999-2000, before the GST was introduced
Direct taxes are taxes on income
or profits, Indirect taxes are taxes on goods and services
One of the Government’s reasons
for reform at the time the GST was introduced was
‘the Commonwealth will become increasingly reliant
on income directly levied on individuals... tax rates would rise and the system
become even more unfair as those individuals who had the opportunity to avoid
tax increasingly did so. The indirect tax base would continue to decline
[and] rates would need to be increased again’ [8]’
|
Figure
7: Direct and Indirect Taxes (% of total receipts)
Source:
Australian Government, Budget strategy and outlook: budget paper no. 1:
2017–18, 2017, Statement 5: revenue, online supplementary
tables.
|
|
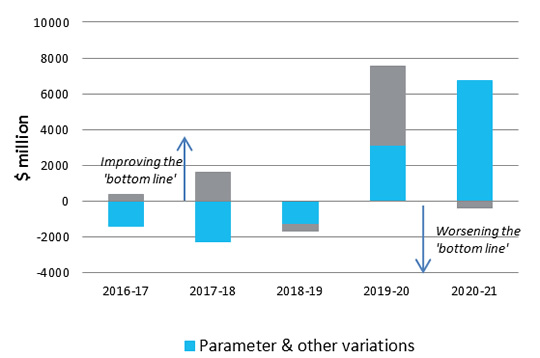
Effect
on the Underlying Cash Balance of changes since MYEFO
| Year |
Policy
measures
$m |
Parameter
variations
$m |
| 2016–17 |
-1,429 |
343 |
| 2017–18 |
-2,299 |
1,599 |
| 2018–19 |
-1,303 |
-407 |
| 2019–20 |
3,128 |
4,394 |
| 2020–21 |
6,724 |
-390 |
|
Figure 8: Effect of
policy and parameter changes
on the Underlying Cash Balance since MYEFO
Source: Australian
Government, Budget strategy and outlook: budget paper no. 1: 2017–18, Statement 3: overview, Table 6, p. 3-27.
|
|
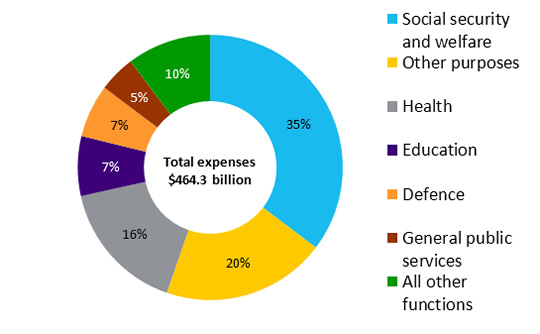
Where does government spending go
in 2017–18?
Estimates
of Expenses by function
| |
$b |
% |
| Social
security & welfare |
164.1 |
35.3 |
| Health |
75.3 |
16.2 |
| Education |
33.8 |
7.3 |
| Defence |
30.1 |
6.5 |
| General
public services |
20.7 |
4.5 |
| All
other functions |
47.6 |
10.2 |
| Other
purposes |
92.8 |
20.0 |
| Total |
464.3 |
100.0 |
|
Figure
9: Expenses by function in 2017–18
Source: Australian
Government, Budget 2017–18, Budget overview, 9 May 2017, Appendix B, p. 25.
|
|
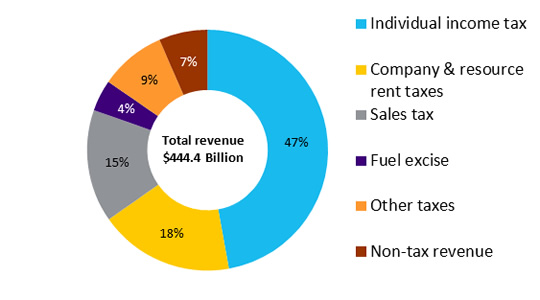
Where does the revenue come
from
in 2017–18?
| |
$b |
% |
| Individuals
income tax |
209.6 |
47.2 |
| Company
& resource rent taxes |
80.4 |
18.1 |
| Sales
tax (incl. the GST) |
67.3 |
15.1 |
| Fuels
excise |
18.7 |
4.2 |
| Other
taxes |
39.4 |
8.9 |
| Non-tax
revenue |
29.0 |
6.5 |
| Total |
444.4 |
100 |
|
Figure
10: Revenue in 2017–18
Source: Australian Government, Budget 2017–18, Budget overview, 9 May 2017, Appendix B, p. 25.
|
The headline economic forecasts
Table 1: Treasury forecasts of
major economic parameters (per cent)
| |
2015–16 |
2016–17 |
2017–18 |
2018–19 |
2019–20 |
2020–21 |
| Real GDP |
2.6 |
1.75 |
2.75 |
3 |
3 |
3 |
| Employment |
1.9 |
1 |
1.5 |
1.5 |
1.5 |
1.5 |
| Unemployment Rate |
5.7 |
5.75 |
5.75 |
5.5 |
5.5 |
5.25 |
| Consumer Price Index |
1 |
2 |
2 |
2.25 |
2.5 |
2.5 |
| Wage Price Index |
2.1 |
2 |
2.5 |
3 |
3.5 |
3.75 |
| Nominal GDP |
2.3 |
6 |
4 |
4 |
4.5 |
4.75 |
| Terms of Trade |
-10.2 |
16.5 |
-2.75 |
-4.25 |
|
|
Source: Australian Government, Budget strategy and outlook: budget paper no. 1:
2017–18, Statement 1: Budget
overview, Table 2, p. 1-9;
Statement 2: economic outlook,
Table 1, p. 2-6.
The
Budget only forecasts Terms of Trade to 2018-19.
Table A1 provides a
snapshot of how these forecasts have changed since last year’s budget (see
Attachment A).
|
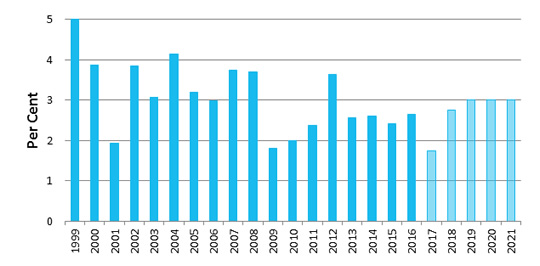
Economic growth is forecast
to improve
Annual real GDP growth is
expected to fall to 1.75 per cent in 2016-17 to due to events related to
Tropical Cyclone Debbie
It is expected to increase to 3
per cent in 2018‑19 and remain at the level, around its 20 year
average, to 2020-21. |
Figure 11: Real GDP
Growth %
Source: Australian Bureau
of Statistics (ABS), Australian national accounts: national income,
expenditure and product, December 2016, cat. no. 5206.0, ABS, Canberra, March 2017.
|
|
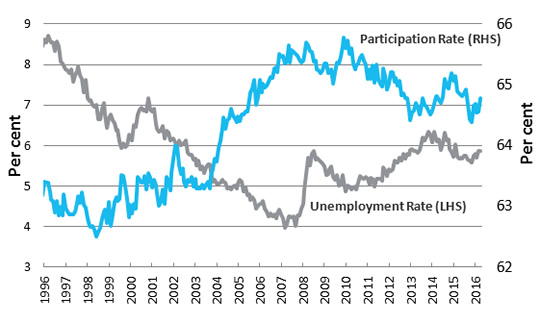
The Unemployment rate is expected
to fall to 5.25 per cent in 2020-21, around its lowest level since 2011-12
|
Figure
12: Unemployment and Participation % of Labour Force
Source: ABS, Labour
force, Australia, March 2017, cat. no. 6202.0, ABS, Canberra, April 2017.
|
|
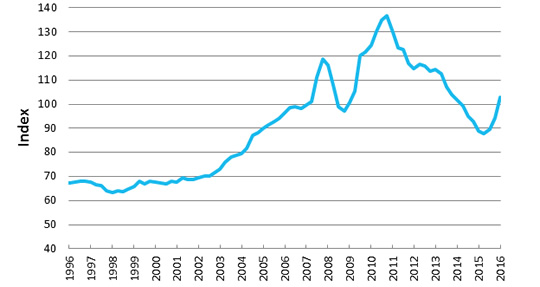
In recent years large falls in
commodity prices have driven a significant decline in Australia’s terms of
trade.
A near-term boost in commodity
prices is expected to improve the terms of trade in 2016-17, before declining
slightly in 2017-18 and 2018-19. |
Figure
13: Terms of Trade Index
Source: Australian Bureau of Statistics (ABS), Australian
national accounts: national income, expenditure and product, December 2016,
cat. no. 5206.0, ABS, Canberra, March 2017.
|
|
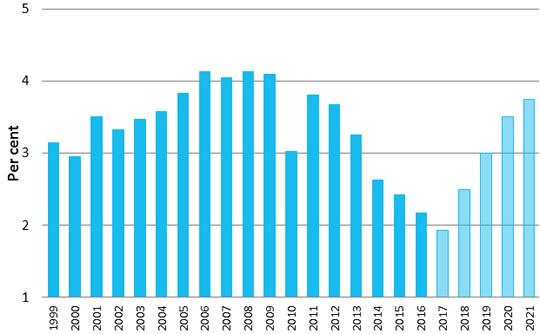
Wage price growth has been
weak in recent times
The wage price index (WPI) is
calculated by comparing the cost of wages over time for the same work level
and output
Annual forecast wage growth in
2016-17 is forecast to be 2 per cent, the lowest rate of growth since the
start of the series in 1998.
Wage growth is expected to be
3.75 per cent in 2020-21 its highest level since 2010-11.
|
Figure
14: Wage Price Index Growth
Source: Reserve Bank of Australia (RBA), Statistical
tables, H4 – Labour Costs and Productivity.
|
Attachment A
Table A1: Treasury forecasts of
major economic parameters (per cent)
| |
2015–16 |
2016–17 |
2017–18 |
2018–19 |
2019–20 |
2020–21 |
| Real GDP |
|
|
|
|
|
|
| Budget 2016–17 |
2.2 |
2.5 |
2.5 |
3 |
3 |
3 |
| PEFO 2016 |
2.2 |
2.5 |
2.5 |
3 |
3 |
3 |
| MYEFO 2016–17 |
2.7 |
2 |
2.75 |
3 |
3 |
|
| Budget 2017–18 |
2.6 |
1.75 |
2.75 |
3 |
3 |
3 |
| Employment |
|
|
|
|
|
|
| Budget 2016–17 |
1.6 |
2 |
1.75 |
1.75 |
1.25 |
1.5 |
| PEFO 2016 |
1.5 |
2 |
1.75 |
1.75 |
1.25 |
1.5 |
| MYEFO 2016–17 |
1.9 |
1.25 |
1.5 |
1.5 |
1.5 |
1.5 |
| Budget 2017–18 |
1.9 |
1 |
1.5 |
1.5 |
1.5 |
1.5 |
| Unemployment Rate |
|
|
|
|
|
|
| Budget 2016–17 |
6.1 |
5.75 |
5.5 |
5.5 |
5.5 |
5.5 |
| PEFO 2016 |
6.1 |
5.75 |
5.5 |
5.5 |
5.5 |
5.5 |
| MYEFO 2016–17 |
5.7 |
5.5 |
5.5 |
5.25 |
5.25 |
|
| Budget 2017–18 |
5.7 |
5.75 |
5.75 |
5.5 |
5.5 |
5.25 |
| Consumer Price Index |
|
|
|
|
|
|
| Budget 2016–17 |
1.5 |
1.25 |
2 |
2.25 |
2.5 |
2.5 |
| PEFO 2016 |
1.5 |
1.25 |
2 |
2.25 |
2.5 |
2.5 |
| MYEFO 2016–17 |
1 |
1.75 |
2 |
2.5 |
2.5 |
|
| Budget 2017–18 |
1 |
2 |
2 |
2.25 |
2.5 |
2.5 |
| Wage Price Index |
|
|
|
|
|
|
| Budget 2016–17 |
2.3 |
2.25 |
2.5 |
2.75 |
3.25 |
3.5 |
| PEFO 2016 |
2.3 |
2.25 |
2.5 |
2.75 |
3.25 |
3.5 |
| MYEFO 2016–17 |
2.1 |
2.25 |
2.5 |
3.25 |
3.5 |
|
| Budget 2017–18 |
2.1 |
2 |
2.5 |
3 |
3.5 |
3.75 |
| Nominal GDP |
|
|
|
|
|
|
| Budget 2016–17 |
1.6 |
2.5 |
4.25 |
5 |
5 |
5 |
| PEFO 2016 |
1.6 |
2.5 |
4.25 |
5 |
5 |
5 |
| MYEFO 2016–17 |
2.3 |
5.75 |
3.75 |
4.25 |
4.5 |
|
| Budget 2017–18 |
2.3 |
6 |
4 |
4 |
4.5 |
4.75 |
| Terms of Trade |
|
|
|
|
|
|
| Budget 2016–17 |
-10.3 |
-8.75 |
1.25 |
0 |
|
|
| PEFO 2016 |
|
1.25 |
0 |
|
|
|
| MYEFO 2016–17 |
-10.2 |
14 |
-3.75 |
|
|
|
| Budget 2017–18 |
-10.2 |
16.5 |
-2.75 |
-4.25 |
|
|
Source:
Australian Government, Budget strategy and outlook: budget paper no. 1:
2016–17, Statement 1,
Table 2, p. 1-8, Statement 2, Table 1, p. 2-6; S Morrison
(Treasurer) and M Cormann (Minister for Finance), Pre-election economic and fiscal outlook 2016, Table 2, May 2016, p. 16; Australian Government,
Mid-year economic and fiscal outlook 2016–17, Table 1.2, p. 2, Table 2.2, May 2016, p.
11; Australian Government, Budget strategy and outlook: budget paper no. 1:
2017–18, 2017, Statement 1,
Table 2, p. 1-9, Statement 2, Table 1, p. 2-6.
[1].
S Morrison (Treasurer), Budget
speech 2017–18.
[2].
This refers to income and other withholding taxes, plus FBT and
superannuation taxes.
[3].
T Clark , A Lukin and D Wood, ‘Treasurer Scott Morrison’s 2017-18 budget speech, annotated
by experts’, The Conversation, 10 May 2017.
[4].
This refers to company income tax plus resource rent taxes
[5].
Australian Government, Budget
strategy and outlook: budget paper no. 1: 2017–18, Statement 5:
revenue, p. 5-13.
[6].
This includes the Goods and Services Tax (GST), Wine Equalisation Tax
(WET) and Luxury Car Tax.
[7].
N Gupta, P Hawkins and H Portillo-Castro, Pre-budget
snapshot of the Australian economy: a quick guide,
Research paper series, 2016–17, Parliamentary Library, Canberra, 9 May 2017.
[8].
P Costello (Treasurer), Tax
Reform not a new tax a new tax system – The Howard Government’s plan for a New
Tax System - Overview, report, August 1998
All online articles accessed May 2017.
For copyright reasons some linked items are only available to members of Parliament.
© Commonwealth of Australia

Creative Commons
With the exception of the Commonwealth Coat of Arms, and to the extent that copyright subsists in a third party, this publication, its logo and front page design are licensed under a Creative Commons Attribution-NonCommercial-NoDerivs 3.0 Australia licence.
In essence, you are free to copy and communicate this work in its current form for all non-commercial purposes, as long as you attribute the work to the author and abide by the other licence terms. The work cannot be adapted or modified in any way. Content from this publication should be attributed in the following way: Author(s), Title of publication, Series Name and No, Publisher, Date.
To the extent that copyright subsists in third party quotes it remains with the original owner and permission may be required to reuse the material.
Inquiries regarding the licence and any use of the publication are welcome to webmanager@aph.gov.au.
This work has been prepared to support the work of the Australian Parliament using information available at the time of production. The views expressed do not reflect an official position of the Parliamentary Library, nor do they constitute professional legal opinion.
Any concerns or complaints should be directed to the Parliamentary Librarian. Parliamentary Library staff are available to discuss the contents of publications with Senators and Members and their staff. To access this service, clients may contact the author or the Library‘s Central Enquiry Point for referral.