Gregory O’Brien,
Statistics and Mapping
Key Issue
Trade has been a key issue since the first Federal Parliament saw the Protectionist Party in government faced with an opposition with a strong contingent of Free Traders. Trade continues to be central to the Australian economy and has grown as a proportion of national income in recent years as transport, communications technologies and rising living standards in Asia have increased regional markets for Australian exports.
This article provides a brief overview of the
importance of trade to the Australian economy, key export markets for
Australian goods and services, and the main exports produced by Australia.
Trade as a share of GDP
One way of visualising the importance of trade to
the Australian economy over time is by looking at the proportion of Gross Domestic
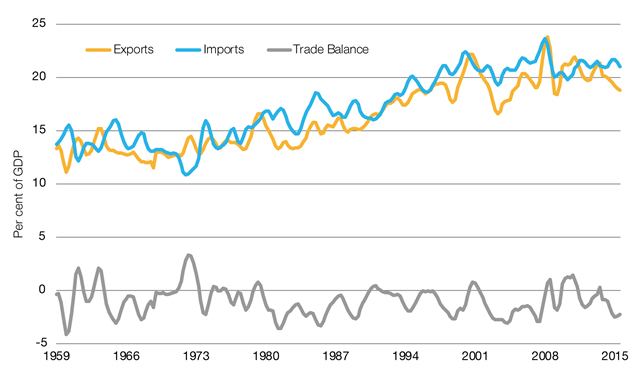
Product (GDP) represented by trade. Figure 1 shows exports and imports on a
Balance of Payments basis since 1959 and Australia’s trade balance over the
period (the difference between Australian exports and imports in a quarter).
It shows that despite some volatility, trade
represented a reasonably steady proportion of GDP throughout the 1960s and
1970s, increasing as a share of GDP since the 1980s and peaking in 2008 at
around 23 per cent. The last few years have seen a slight easing-off to average
around 21 per cent of GDP. This means that around a fifth of all goods and
services (by value) produced in Australia are traded internationally.
While Australia is often thought of as a trading
nation, this proportion is low by international standards as our lack of land
borders reduces the amount of local international trade compared with other
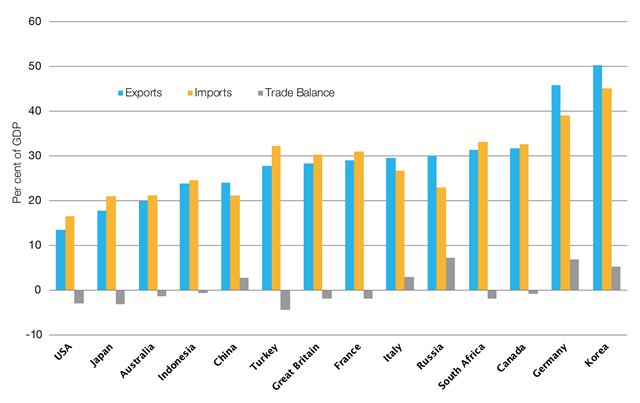
countries. Figure 2 shows exports, imports and trade balances as a proportion
of GDP for a selection of G20 members. Trade is a larger proportion of GDP for
Australia than the large economies of the United States and Japan, but is lower
than most other countries, particularly European countries and export-focused
economies such as Germany and South Korea.
Figure 2 also shows the relative trade balances of
these countries. In 2014, Australia had a trade deficit of 1.4 per cent of GDP,
much less than the US and Japan which both ran trade deficits over 3 per cent.
It also contrasts with trade surplus countries such as Germany, which had a 6.7
per cent surplus and South Korea, which had a 5.4 per cent surplus.
It is important to note while looking at
cross-country comparisons that while trade balances must offset each other
globally, for any single country, trade balances can persist over many years or
decades. For example, Australia has persistently run trade deficits over the
long-term, as shown in Figure 1. This can occur as trade
imbalances can be offset by contrasting balances in international income
transfers, or financial or capital account transactions within the Balance of
Payments.
Figure 1: Australian exports, imports and trade
balance as a proportion of GDP

Source: Australian Bureau of Statistics (ABS),
Australian national accounts, cat. no. 5206.0, ABS, Canberra, March
2016.
Figure 2: Exports, imports and trade balance
as a proportion of GDP in select G20 economies

Source: OECD, Trade in goods and
services (indicator), 29 July 2016.
Table 1: Australia’s top export markets
| Rank |
Country |
2000 |
2007 |
2015 |
2015 |
5 year
growth trend |
| |
|
A$m |
A$m |
A$m |
% share of total |
% |
| 1 |
China |
6 868 |
27 659 |
91 297 |
28.8 |
8.1 |
| 2 |
Japan |
25 342 |
34 715 |
42 355 |
13.4 |
–1.5 |
| 3 |
United States |
16 725 |
15 609 |
22 114 |
7.0 |
8.4 |
| 4 |
South Korea |
9 869 |
15 418 |
20 014 |
6.3 |
–2.7 |
| 5 |
India |
2 298 |
11 265 |
13 574 |
4.3 |
–9.3 |
| 6 |
New Zealand |
9 254 |
12 891 |
12 577 |
4.0 |
2.7 |
| 7 |
Singapore |
7 954 |
7 308 |
11 044 |
3.5 |
7.3 |
| 8 |
United Kingdom |
7 609 |
11 812 |
8 815 |
2.8 |
–7.8 |
| 9 |
Malaysia |
3 261 |
4 464 |
7 966 |
2.5 |
9.1 |
| 10 |
Taiwan |
6 022 |
6 446 |
7 479 |
2.4 |
–4.3 |
| 11 |
Indonesia |
3 928 |
4 751 |
6 804 |
2.1 |
3.6 |
| 12 |
Hong Kong (SAR of China) |
4 731 |
4 361 |
5 591 |
1.8 |
3.0 |
| 13 |
Thailand |
2 496 |
5 206 |
5 331 |
1.7 |
–5.2 |
| 14 |
Vietnam |
622 |
1 764 |
4 696 |
1.5 |
14.0 |
| 15 |
United Arab Emirates |
1 165 |
3 548 |
4 020 |
1.3 |
9.4 |
| |
Total goods &
services exports |
145 086 |
218 004 |
316 590 |
100.0 |
2.1 |
Source: Department of Foreign Affairs and
Trade (DFAT), Australia’s trade in goods and services 2015, DFAT,
Canberra, March 2016.
Table 2: Australia’s top 15 export products
| Rank |
Commodity |
2013 |
2014 |
2015 |
2015 |
5 year growth trend |
| |
|
A$m |
A$m |
A$m |
% share of total |
% |
| 1 |
Iron ores & concentrates |
69 492 |
66 008 |
49 060 |
15.5 |
0.9 |
| 2 |
Coal |
39 805 |
37 999 |
37 031 |
11.7 |
–3.9 |
| 3 |
Education-related travel services |
15 010 |
17 037 |
18 801 |
5.9 |
3.3 |
| 4 |
Natural gas |
14 602 |
17 743 |
16 456 |
5.2 |
13.0 |
| 5 |
Personal travel (excl. education) services |
13 171 |
14 187 |
15 943 |
5.0 |
6.2 |
| 6 |
Gold |
13 898 |
13 460 |
14 500 |
4.6 |
–1.2 |
| 7 |
Beef, f.c.f. (fresh, chilled or frozen) |
5 695 |
7 751 |
9 296 |
2.9 |
16.9 |
| 8 |
Aluminium ores & conc. (incl. alumina) |
5 904 |
6 336 |
7 493 |
2.4 |
6.8 |
| 9 |
Crude petroleum |
9 016 |
10 564 |
6 036 |
1.9 |
–8.8 |
| 10 |
Wheat |
6 085 |
5 920 |
5 814 |
1.8 |
4.4 |
| 11 |
Professional services |
4 600 |
4 840 |
5 190 |
1.6 |
10.8 |
| 12 |
Copper ores & concentrates |
5 192 |
5 359 |
4 825 |
1.5 |
–0.8 |
| 13 |
Other ores & concentrates (a) |
4 486 |
4 594 |
4 436 |
1.4 |
0.1 |
| 14 |
Business travel |
4 200 |
4 203 |
4 407 |
1.4 |
5.6 |
| 15 |
Aluminium |
3 675 |
3 968 |
3 934 |
1.2 |
–3.0 |
|
Total goods and services exports |
302 276 |
331 241 |
318 737 |
|
4.2 |
Note: (a) Other ores & concentrates
consists mainly of Lead, Zinc and Manganese ores & concentrates.
Source: DFAT, Australia’s trade in goods
and services 2015, DFAT, Canberra, March 2016.
Australia’s top export markets
The
Department of Foreign Affairs and Trade publishes a range of statistics
describing Australia’s trade figures. Australia’s Trade in Goods and Services,
released every six months, provides a good overview of Australia’s top export
markets and export sectors.
Table 1 shows Australia’s top
export markets for 2015, the share of Australia’s total exports which went to
each market (by value) and growth in exports over the five years to 2015.
Figures for 2000 and 2007 are included to show longer-term relative growth
trends.
This table shows some of the trends
driving Australian export growth. The rise of China as a key export market is
clear, demonstrated by 28.8 per cent of Australia’s exports being destined for
China, and the remarkable growth since 2000 in Australian exports to this
market from under $7 billion in 2000 to over $90 billion in 2015. The
concentration of Australian export markets is also evident with the top four
markets (China, Japan, US and South Korea) accounting for over half (55 per
cent) of all exports.
Southeast Asia has seen some of the strongest growth trends in the
last five years with exports to Singapore, Malaysia, Indonesia and Vietnam all
showing strong growth.
The inclusion of the United Arab
Emirates is indicative of the strong growth in exports to the Middle East in
recent years.
The Department of Foreign Affairs
and Trade produces individual
fact sheets for most countries and regions to which Australia exports.
Australia’s top export products
As with Australia’s
export markets, Australia’s top export products are more concentrated than
imports.
Table 2 shows the top 15 export products
for 2015 with relative shares of total exports and growth rates for the five
years to 2015.
Despite the fall in iron ore
prices and the correspondent drop in export revenue, iron ore remains
Australia’s largest export, followed by coal. These two commodities alone
represent over a quarter of all export earnings. Primary products still
represent the majority of Australia’s top exports, with beef and wheat the
largest agricultural sources of export earnings, and oil and gas, gold and
other metals representing the other top goods exports.
Services have become an
increasingly important component of Australia’s export revenue, with
education-related, personal and business travel, and professional services all
in the top 15 export categories. The growth rates of the services categories
show that strong growth in these areas over the past five years has helped
offset lower growth rates in some resource sectors.
Further reading
Australian Bureau of Statistics (ABS), International trade in goods and services, cat. no. 5368.0, ABS, Canberra, released monthly.
Department of Foreign Affairs and Trade (DFAT),
Australia’s trade in goods and services, DFAT, Canberra, released biannually.
Back to Parliamentary Library Briefing Book
For copyright reasons some linked items are only available to members of Parliament.
© Commonwealth of Australia

Creative Commons
With the exception of the Commonwealth Coat of Arms, and to the extent that copyright subsists in a third party, this publication, its logo and front page design are licensed under a Creative Commons Attribution-NonCommercial-NoDerivs 3.0 Australia licence.