Chapter 2 - Economic conditions
‘Never forget the politics and never forget which side
we’re on. We’re on the side of making profits. We’re on the side of people
owning private capital.’
- Peter Reith, 9 July 1999
Introduction
2.1
Very little evidence has been put to the
Committee supporting the notion that the reforms of 1996, of themselves, have
had a positive impact on employment and industrial outcomes on the Australian
economy.
2.2
Employment growth is a function of a number of
factors and not restricted to the one-dimensional solutions often cited by some
– be they unfair dismissal or reduced wages and conditions.
2.3
A multiplicity of factors influence the
efficient and equitable operation of the labour market. Often, the operation
of the labour market is analysed from a purely static and narrow perspective.
For instance, the fact that wages paid to workers, while representing a cost to
employers also represent income to individuals and families is often
overlooked. From a dynamic perspective, it is important to recognise the
linkages between the labour market, narrowly defined, the macro economy and
living standards when considering labour market reforms.
2.4
A well functioning labour market should underpin
good microeconomic and macroeconomic policies and also contribute to the
standard of living of families. Income and job security and job satisfaction
are important criteria in this respect.
2.5
The Inquiry has been presented with very little
evidence that the 1996 reforms are directly responsible for strong employment
outcomes, strong growth in capital and labour productivity, or improved
standards of living.
2.6
From a dynamic perspective, labour market
reforms should effect improvements in both the supply and demand for labour.
The reforms since 1996 have done little to advance improvements in skills and
human capital. Indeed, severe budget cuts have targeted education and labour
market assistance programs. These are major deficiencies represented by
unbalanced policy making, the consequences of which are dynamic in nature and
not generally reflected in the short run.
2.7
An important, but often overlooked element, in
labour market reform relates to management practices. International best
practice and management horizons which extend beyond the short term are
fundamental to generating harmonious workplaces and generating both labour
efficiencies but also innovation amongst workers. Organisational structure is
a fundamental source of innovation, yet barely rates a mention in either the
1996 labour market reforms or the Government’s proposed 1999-2000 reforms. The
Committee received convincing evidence specifically addressing this issue from
Mr Hugh McBride who said:
In other words, the problems are not in the workplace, they are
not in the unions – they are in the system. That is not a matter of hearsay,
ideology or theory; it is fact. There is plenty of evidence to support that.
The evidence is the productivity and competitiveness of the Japanese firms and
the US firms that have adopted total quality management in partnership with
their unions. Those are facts. You do not fix it by getting rid of unions, you
do not fix it by bashing the unions over the head and you do not fix it by
punitive measures on the workers. If you go down this path – and this is the
significant point – you create an atmosphere in the workplace where it is very
difficult to get cooperation and accommodation out of the workers.[1]
Employment
Employment growth post 1996
2.8
It is instructive to note that with roughly
similar economic growth rates in the period 1993-1996 and 1996-1999, the
employment growth rate has been slower post-1996 reforms. Graph 1
highlights this differential performance.
Graph 1
2.9
The clear slow down in the pace of employment
growth in the last 3½ years, despite similar economic growth rates to the
previous three years correlates with:
- Severe budget cuts in Commonwealth budgets since 1996-97;
- $1.8 billion worth of budget cuts by the Commonwealth in labour
market assistance programs;
- Cuts to education in Commonwealth budgets since 1996-97; and
- Cuts to assistance provided to research and development –
primarily through the cuts to the tax concession available for research and
development activities.
2.10
In sum, these budget cuts go to those things
that drive economic growth in the medium to long term – employability and
adjustment to work, skills and innovation.
Full time employment growth post
1996
2.11
A closer examination of the aggregate data
reveals that in the period February 1993 to February 1996, nearly 60 per cent
of the 730,800 jobs that were created were full-time jobs. By contrast, in the
period between February 1996 and October 1999, only around half of 551,400 jobs
created were full-time jobs. Graph 2 highlights the comparative
employment performance in full-time job creation.
Graph 2
2.12
One of the important elements to reducing the
potential for labour market bottlenecks and, to some extent, a quasi measure of
flexibility in the labour market is the extent to which the economic system
assists those most disadvantaged in the labour market. The long term
unemployed, in particular, are recognised amongst the most disadvantaged in the
labour market. They represent a pool of non-utilised workers in the economy
and to the extent that their capabilities are not utilised, there is an
associated economic loss to the nation.
2.13
With respect to the performance of the economy
and the labour market to address this economic problem, it is instructive that
in the period since the 1996 reforms and the $1.8 billion budget cuts to labour
market assistance programs, there has been a marked slowdown in improvements in
this area of the labour market.
Reduction on long term unemployed
weaker after 1996
2.14
Graph 3
highlights this marked difference in long term unemployment outcomes within the
past 6 and half years. In the period February 1993 to February 1996, the
number of long term unemployed declined by 108,500 . In comparison, in the
period February 1996 to October 1999, the reduction has been a mere 22,100.
Graph 3
2.15
More importantly, the benefits of economic
growth has failed to distribute the benefits to those who have been unemployed
for more than 2 years – the very long term unemployed. This is a group with an
over representation of mature aged Australians, and has significant implications
for the standard of living of Australians who have already contributed much to
the economy but who now find themselves being structured out of the labour
market with few means of effecting a transition back to work.
2.16
Graph 4
highlights the comparative employment performance for the very long term
unemployed.
Graph 4
2.17
Graph 4 is
instructive in highlighting the lack of progress made in the period since 1996
of getting those unemployed for more than 2 years back into work.
Participation rate post 1996
2.18
The divide between 1993 – 96 and 1996 – 99 with
respect to the labour market has not been confined only to actual employment
outcomes, but has extended to the degree of participation in the labour
market. Contrary to economic expectations and historical evidence, the
continuation of economic growth in the post 1996 period has not been associated
with strong growth in the participation rate.
2.19
Graph 5
highlights this comparative performance on the participation rate for two
periods within the past 6 and half years. It reveals that in the period
February 1993 to February 1996, the participation rate rose strongly, while it
has fallen in the period February 1996 to October 1999. In a period of
continued economic growth, Australians have been discouraged out of the labour
market in the period post 1996.
Graph 5
2.20
While the Government has cited the improvement
in labour productivity as vindication of the 1996 industrial relations laws, it
is important, from an economic perspective, to recognise that it is the
combined effects of labour and capital productivity that are the key to
economic growth and reform in the economy.
2.21
Sustained improvements in productivity are
derived from structural reforms generating significant benefits over time. It
is widely recognised that Australia’s ‘step-up’ in productivity is the function
of reforms made primarily as a result of the economic policies of the Hawke and
Keating Labor Governments in diverse areas such as:
- Financial market deregulation in the 1980s and early 1990s;
- Greater openness of the economy;
- Tariff reforms during the 1980s and early 1990s;
- Wage and industrial reforms during the 1980s and 1990s; and
- Competition reforms during the late 1980s and 1990s.
2.22
The major reforms which have resulted in the improvement
in both capital and labour productivity occurred prior to the 1996 changes to
the industrial relations laws. The improvement in both the level and growth
rate of multi-factor productivity represents the gains resulting from 13
years of micro economic reforms.
2.23
As can be seen from Graph 6 the
major improvements in Australia’s productivity performance occurred during
Labor’s term in government a result of more than a decade of micro economic
reforms.
Graph 6
Conclusion
2.24
Despite consistent economic growth over the last
6 years, the labour market, in the period 1996 to 1999 has, when compared to
the previous 3 years, failed to generate the same employment outcomes. Indeed,
the average annual growth of employment in the period February 1993 to February
1996 was 3.1 per cent, while the average annual growth rate in employment in
the period February 1996 to October 1999 has been just 1.76 per cent. As a
result the average monthly employment generation in the period February 1993 to
February 1996 was over 20,000 when compared with only just over an average of
12,000 jobs per month in the period February 1996 to October 1999.
Causes of disputes
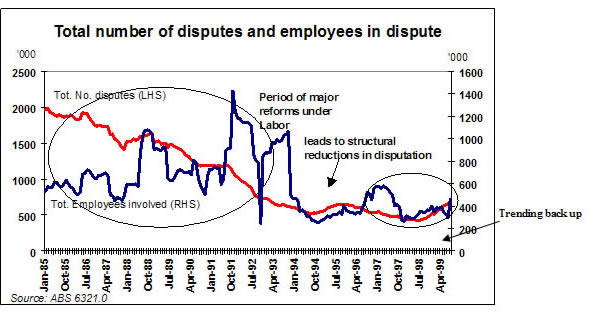
2.25
Contrary to Government claims, the casual
observation of the data on the causes of disputes highlights some important
insights into the effects of many years of reform under Labor:
- A pronounced downward trend in the number of disputes over the
period of the late 1980s and early 1990s; and
-
A structural reduction in the number of employees in disputes in
the 1990s.
2.26
These trends, however, have started to reverse
in more recent years. Graph 7 highlights this for both the total
number of disputes and the number of employees involved.
Graph 7
2.27
Indeed, contrary to Government claims, the data
reveals some disturbing developments in the post 1996 period. The Government’s
ideological obsession of continually attacking the rights and conditions of
workers has blinded it to the flipside of the industrial equation, management
practices. What is clear from the data is that disputes over managerial policy
and physical working conditions have begun to trend upwards since the Coalition
came to office (Graph 8 and 9).
Graph 8
Graph 9
Wage Disparity
2.28
Latest figures on CEO remuneration reveal a 32.7
per cent rise in total earnings between 1997 and 1998 while the latest data on
average weekly earnings reveal that the wages of Australian workers rose by a
mere 2.1 per cent in the year to August 1999 (see Graph 10).
Graph 10
2.29
The Prime Minister recently cited the disparity
between the strong growth in executive salaries compared to those of the
average Australian worker. This is a rare acknowledgment that the benefits of
Australia’s good economic growth performance in recent years have not been
shared across the nation. Graph 11 depicts the downward wage
outcomes being experienced by Australian workers. It is clear that real wage
growth has been slowing in the economy while the salaries of executives have
been rising.
Graph 11
2.30
The relative wages predicament of Australian
workers will be exacerbated by the Government’s policy to introduce a goods and
service tax next year while assuming no wage increases to follow from the
consequent rise in the inflation rate. This assumption translates into a real
wage cut for Australian workers.
Living standards
2.31
The Coalition Government’s policies have had a
negative impact on the living standards of Australian workers and the
unemployed. Workplace insecurity, and the inability of jobseekers to be
assisted back to work, reflect specific policy choices by the Howard
Government. This has impacted most on those least able to deal with it – low
paid workers and the unemployed.
2.32
Since 1996, there has been a distinct reduction
in fairness within the Australian labour market, one that offends the
egalitarian nature of our proud economic and social history.
2.33
On every measure affecting living standards, the
gap between the rich and poor has been widened by Coalition policy:
- wage inequality has grown rapidly, with the wages of the low paid
failing to keep pace with average wages, while executive salaries continue to
soar;
- massive budget cuts since 1996 have hit low-income households the
hardest, as evidenced by research from the Melbourne Institute of Applied
Economic and Social Research;
- the Government’s own modelling confirms that their proposed
changes to the tax system disproportionately benefit high wage earners, while
slugging low-income households with a GST; and
- the Government’s GST package also assumes that Australian workers
should accept a real wage cut stemming from the inflationary impact of the GST.
2.34
The majority also discounted the evidence of
individuals who told the inquiry that their living standards had declined. The
evidence is clear before the inquiry that different groups in the community
have been severely disadvantaged by the Act. Even the Department of Workplace
Relations and Small Business acknowledges this when it acknowledges that income
inequality has increased.
2.35
Furthermore, as is discussed in greater detail
later in the report, it is not possible to obtain a true indication of how the
WR Act has impacted on the living standards due to serious deficiencies in the
availability or existence of detailed data, particularly with respect to the
content of AWAs. Labor Senators concur with the view expressed by Dr David
Peetz that it is unfortunate that no surveys of employees have been conducted
since the introduction of the WR Act. Such data would have provided a more
complete picture of how the Act had impacted on the living standards of
employees. As Dr Peetz described:
...an assessment of the impact of the Workplace Relations Act on
pay and conditions would normally take as one of its main sources data from
employees themselves. For example, information from agreements can tell us
about the size of wage increases (albeit not for all agreements) and the
subject areas covered by changes in conditions, but they cannot tell us whether
employees feel better or worse off as a result. Nor can they tell us the
impact the implementation of the agreement had on productivity...
...The first official report on the operation of the Workplace
Relations Act (Hawke et al 1998) failed to contain data from either employees
or employers. (While such surveys are expensive, it is noteworthy that $3m,
more than enough for such research, was allocated to an advertising campaign
for the Employment Advocate.) Data on the New Zealand experience (based on
employee and employer surveys) indicated that radical legislative change has by
far its greatest impact in the first couple of years after introduction (Hector
& Hobby 1997), so it is particularly unfortunate that there are no
officially collected data from employees on the early impact of the Workplace
Relations Act.
Conclusion
2.36
Changes in industrial relations, taxation and
spending have combined to drastically increase economic and social inequality.
2.37
The deepening divide between the haves and the
have-nots in Australian society has been exacerbated by the increasing pressures
placed on Australian workers, particularly those on lower wages without
adequate bargaining power and protection. The inquiry heard that workforce
insecurity is now commonplace, and is directly related to the 1996 legislation.
2.38
Workforce insecurity and growing inequality are
seriously threatening not only our quality of life, but our social cohesion.
Navigation: Previous Page | Contents | Next Page