Papers on Parliament No. 62
October 2014
Andrew Markus "Trust in the Australian Political System*"
Prev | Contents | Next
Public opinion polls
Public opinion polling is a staple of political life; it is rare that a week passes without the report of a survey in one of our daily newspapers. We lack, however, the capacity to critically evaluate.
Leading newspapers report survey findings as fact, content to fill newspaper columns without any critical scrutiny. Sample size and margin of error may be reported at the foot of tables, but pass without comment. Minor shifts from one survey to the next are presented as significant, the shift of 1% or 2% in the support for a political party worthy of front-page coverage. Yet the margin error for such a survey is close to 3%; if the level of support for a political party is reported as 51%, then we can be confident at the 95% level that support is within the range 48%–54%. The 95% confidence level means that if the poll was repeated 20 times, on 19 occasions the result would be in the range 48%–54%. In other words, a small shift in level of political support is within the margin of error of the previous poll—there has been no statistically significant change.
A second issue is the capacity to locate findings within a context. The reporting of levels of political support is typically contextualised with reference to the findings of previous surveys, as is polling of attitudes to political issues. This is in contrast to reporting of a broad range of social issues. But findings of one political poll are rarely placed in the context of poll results obtained by other agencies, for example comparing Newspoll and Nielsen and Essential Report, with the exception of the week or so preceding an election. The different results obtained by different polling organisations largely pass without notice or scrutiny.
While there is a wealth of surveying of levels of political support, Australia lacks the depth of surveys in a number of western countries. We don’t have an equivalent to the Eurobarometer, conducted by the EU for over twenty years; we don’t have an equivalent of the annual British Survey of Social Attitudes, or the British Citizenship Surveys that were conducted between 2001 and 2011.
The Scanlon Foundation surveys
One of our major assets is provided by the Scanlon Foundation, whose social cohesion surveys were first conducted in 2007 and annually since 2009. For the first time we have long run and systematic surveying to further understanding of public opinion on issues of relevance for social cohesion, with a specific focus on attitudes to immigration and cultural diversity.
The Scanlon Foundation utilises a detailed questionnaire that takes more than fifteen minutes to administer—and large samples that provide the basis for analysis of sub-groups. In addition to the six national surveys conducted to date, local area surveys were conducted in 2007, 2009, 2012 and 2013, with a large online survey of immigrants in 2013. Total respondents to the surveys now number more than 20,000.
The Scanlon–Monash Index of Social Cohesion aggregates data for 18 questions that cover domains of belonging, worth, participation, social justice and acceptance. Benchmarked data against the 2007 survey shows a decline in the Index from the base of 100 to 87.6 in 2013, with the largest decline in the indicators of acceptance/rejection, a finding of potential relevance to the current debate over possible changes to the Racial Discrimination Act.
The wealth of data obtained by the Scanlon Foundation provides for detailed mapping of public opinion on a range of issues of current national concern. The issue of asylum seekers arriving by boat is one example.
A recent survey for the Essential Report provided an indication of the level of concern over the asylum issue. Asked ‘which of these ... issues are you most concerned about?’, of non-economic economic issues ‘border security’ was ranked equal first, along with climate change. Amongst Liberal/National voters, ‘border security’ ranked a clear first, selected by 36%, by 11% Labor, and by 6% Greens.[1]
The Scanlon Foundation surveys[2], along with most other surveys since the Tampa affair of 2001, have found that only a small minority of the population, typically in the range 20%–25%, support permanent residence for asylum seekers arriving by boat.
In seeking to understand attitudes, the Scanlon Foundation survey has asked: ‘What policy should government adopt towards asylum seekers trying to reach Australia by boat’ and presented four response options:
1. They should be allowed to apply for permanent residence
2. They should be allowed to apply for temporary residence only
3. They should be kept in detention until they can be sent back
4. Their boats should be turned back
In 2013, only 18% supported the eligibility for permanent residence, down from 23% in 2012. In contrast, over the last three surveys (2011–13), the proportion indicating the fourth option, the turning back of boats, has increased from 23% to 26% to 33%.
Cross-tabulation with other questions indicates that those favouring the turning back of boats are also more likely to be negative towards immigration and cultural diversity. For example, in response to the proposition that ‘accepting immigrants from many different countries makes Australia stronger’, 27% of the national sample is in disagreement, compared to 49% of those who are of the view that boats should be turned back.
Table 1: Cross-tabulation of selected questions, 2011–13 Scanlon Foundation surveys. Percentage
|
National average
|
Agree that ‘boats should be turned back’
|
|
What do you think of the number of immigrants accepted into Australia at present? Too high
|
40
|
66
|
|
Accepting immigrants from many different countries makes Australia stronger. Disagree
|
27
|
49
|
|
Would you say your attitudes are positive, negative or neutral towards immigrants from Iraq? Negative
|
24
|
44
|
Source: Scanlon Foundation
This is just one illustration of the capacity of the Scanlon Foundation surveys to inform understanding of Australian public opinion; it provides capacity for detailed analysis of a broad range of issues, not least the theme of this lecture, trust in the Australian political system.
The significance of trust
Trust is a central concern for nation states, seen to be a key determinant of effective functioning of democracy. The recent OECD report, Government at a Glance 2013, notes in response to the question ‘why does trust in government matter?’:
Trust in government has been identified as one of the most important foundations upon which the legitimacy and sustainability of political systems are built. Trust is essential for social cohesion and well-being as it affects governments’ ability to govern and enables them to act without having to resort to coercion. Consequently, it is an efficient means of lowering transaction costs in any social, economic and political relationship.[3]
Trust in government is necessary, for example, for gaining support for structural reform, for compliance with law and for minimising avoidance of rules and regulations, such as those relating to taxation. An important observation is that while trust takes time to be established it can be quickly lost. Decline in trust feeds further decline, for example by making it more difficult to retain and recruit the best people for public service.
International findings
To contextualise the Australian experience, surveys in a number of western democracies are considered. The focus is on a range of surveys, to determine patterns of consistency and change; time-series data is essential to provide a context for interpretation.
In Europe and the United States, there is evidence of stable indicators of trust in some countries, but also marked variation in others impacted by the Global Financial Crisis.
The Edelman Trust Barometer for 2014, which is based on 2013 surveys, indicated that trust in government fell (‘plunges to historic low’) globally by four percentage points to 44%. Amongst the general population, trust in government was below 50% in 22 of the 27 countries surveyed, with very low levels in Western Europe: 14% in Spain, 18% in Italy, 20% in France.[4]
The Gallup World Poll found that between 2007 and 2012 within OECD countries level of confidence in national governments fell from 45% to 40%, just five percentage points. But there was a large measure of change in some nations experiencing economic crisis.
|
Table 2: Confidence in national government in 2012 and change since 2007. Selected countries, percentage
|
|
2012
|
Percentage point change 2007–12
|
|
Greece
|
13
|
-25
|
|
Japan
|
17
|
-7
|
|
Czech Republic
|
17
|
-10
|
|
Hungary
|
21
|
-4
|
|
Korea
|
23
|
-1
|
|
Portugal
|
23
|
-22
|
|
Slovenia
|
24
|
-24
|
Source: OECD (Gallup World Poll)
The latest Gallup survey, conducted in April–June 2013, recorded further falls, although in some countries, given the very low levels of trust, the rate of decline was small or had stabilised. For example, in Greece it was 13% in 2012, 14% in 2013. The level of trust was below 20% in Greece, Italy, Portugal, and Spain.
Table 3: ‘In [country] do you have confidence in the national government, or not?’ Response: ‘Yes’, percentage
|
2008
|
2009
|
2010
|
2011
|
2012
|
2013
|
|
Portugal
|
34
|
28
|
25
|
21
|
23
|
15
|
|
Spain
|
58
|
42
|
30
|
31
|
33
|
18
|
|
Greece
|
38
|
32
|
24
|
18
|
13
|
14
|
|
Italy
|
36
|
42
|
33
|
26
|
24
|
14
|
Source: Gallup
The United States has also experienced declining levels of trust. The New York Times/ CBS News has been measuring response to the question ‘Do you approve of the way Congress is handling its job?’ since 2002. In February 2014 the level of approval, at 13%, was close to a historical low, having declined from 49% in July 2002.
A longer historical perspective, however, produces a somewhat different understanding—and highlights the need for careful reading of data. American Gallup polls confirm that the current levels of confidence are at a very low level, but there is no downward straight line to 2014.
Table 4: ‘Do you approve of the way Congress is handling its job?’ Percentage
|
Approve
|
Disapprove
|
DK/NA
|
|
July 2002
|
49
|
38
|
14
|
|
July 2003
|
39
|
46
|
15
|
|
Oct. 2004
|
38
|
46
|
16
|
|
July 2005
|
33
|
50
|
17
|
|
July 2006
|
28
|
58
|
14
|
|
July 2007
|
29
|
59
|
12
|
|
Sept. 2008
|
15
|
72
|
13
|
|
March 2009
|
30
|
56
|
14
|
|
July 2009
|
22
|
65
|
13
|
|
June 2010
|
19
|
70
|
11
|
|
June 2011
|
20
|
70
|
10
|
|
July 2012
|
12
|
79
|
9
|
|
July 2013
|
17
|
76
|
6
|
|
Sept. 2013
|
24
|
68
|
8
|
|
Feb. 2014
|
13
|
80
|
7
|
Source: New York Times/ CBS News Poll, 19–23 February 2014
Figure 1: Trust in government in Washington

Source: Gallup, Trust in Government, http://www.gallup.com/poll/5392/trust-government.aspx. Copyright © 2013 Gallup, Inc. All rights reserved. The content is used with permission; however, Gallup retains all rights of republication.
In response to the question: ‘How much of the time do you think you can trust government in Washington to do what is right?’, with the response options ‘just about always’, ‘most of the time’, or ‘only some of the time’, with ‘never’ a volunteered response, just 19% in the most recent Gallup survey indicated ‘just about always’ and ‘most of the time’. But this level has precedent; it is a return to the level of the early 1990s. Gallup polling indicates that trust was increasing in the late 1990s, reached a high point in the aftermath of the 9/11 attacks on the United States, and has declined since that time.
Decline of trust in the United States may also be indicated by the loss of trust in the major political parties. In 2002 there was almost equal support at close to 33% for the Republicans and Democrats—and for independents. In 2013, however, the recorded level of support for independents was 42%, the highest since Gallup began conducting interviews by telephone 25 years ago.[5]
Findings of the Scanlon Foundation surveys
Since 2007 the Scanlon Foundation surveys have included a question on trust in government. In wording similar to Gallup, respondents are asked: ‘How often do you think the government in Canberra can be trusted to do the right thing for the Australian people?’ There are four response options, ‘almost always’, ‘most of the time’, ‘only some of the time’, and ‘almost never’. The highest proportion indicating the first or second response options, ‘almost always’ or ‘most of the time’, was 48% in 2009, with a low point of 26% in 2012, a fall of 21 percentage points.
Table 5: ‘How often do you think the government in Canberra can be trusted to do the right thing for the Australian people?’ Percentage
|
‘Almost always’ or ‘most of the time’
|
|
2007
|
39.0
|
|
2009
|
47.6
|
|
2010
|
31.4
|
|
2011
|
30.5
|
|
2012
|
26.2
|
|
2013
|
27.2
|
Source: Scanlon Foundation
There is scope to analyse these findings by a number of demographic and attitudinal variables, including gender, age, level of education, financial status, country of birth, and intended vote. For this sub-group analysis, data from the four surveys conducted between 2010 and 2013 are aggregated, to increase sample size and hence level of reliability. In these years there was only minor variance in the level of trust
(27%–31%).
The sub-group analysis indicates that highest levels of trust are obtained for those intending to vote Labor (49%), aged 18–24 (42%), with a university degree (39%), and those who describe their financial circumstances as ‘prosperous’ or ‘very comfortable’ (37%).
Table 6: ‘How often do you think the government in Canberra can be trusted to do the right thing for the Australian people?’ Response: ‘almost always’, ‘most of the time’, 2010–13, percentage
|
Gender
|
Female
|
Male
|
|
|
|
|
|
27.6
|
30.4
|
|
|
|
|
|
State
|
Victoria
|
NSW
|
WA
|
SA
|
QLD
|
|
|
31.1
|
28.2
|
29.7
|
29.5
|
26.3
|
|
|
Region
|
Capital
|
Rest of state
|
|
|
|
|
|
30.8
|
25.7
|
|
|
|
|
|
Age
|
18–24
|
25–34
|
35–44
|
45–54
|
55–64
|
65+
|
|
42.1
|
30.9
|
29.9
|
25.5
|
26.1
|
23.2
|
|
Highest
completed education
|
BA or
higher
|
Diploma/
Technical Certificate
|
Trade/
Apprenticeship
|
Year 12
|
Up to Year 11
|
|
|
39.3
|
28.3
|
27.4
|
31.6
|
20.6
|
|
|
Financial
situation
|
Prosperous/
very comfortable
|
Reasonably
comfortable
|
Just getting
along
|
Struggling to pay
bills / poor
|
|
|
|
37.0
|
31.8
|
24.2
|
20.3
|
|
|
|
Intended
vote
|
Labor
|
Liberal/ National
|
Greens
|
|
|
|
|
48.5
|
18.7
|
27.3
|
|
|
|
|
Birthplace
|
Overseas-NESB
|
Overseas-ESB
|
Australia
|
|
|
|
|
|
33.4
|
26.8
|
28.2
|
|
|
|
|
|
|
|
|
|
|
|
|
|
Source: Scanlon Foundation
The lowest levels are obtained for those intending to vote Liberal or National (19%), with highest completed education below Year 12 (21%), and aged 65 or over (23%).
These are overlapping variables and indicate differences within segments of the population. For example, high educational attainment is associated with higher income; those aged 65 or over have a relatively high proportion with limited formal education. The association of intended vote with level of trust is an important finding, one to which I will return.
A range of additional variables is available for analysis of the Scanlon Foundation surveys. These include surveys of local areas and point to geographical areas where level of trust in government is below 20%.
In 2012 and 2013 surveys were conducted in nine low socio-economic localities, each with a sample of 500. Six of the areas surveyed are urban and with high levels of immigrant concentration; the other three are regional.
As noted, the national level for trust in 2012 and 2013 is in the range 26% to 27%; the finding of the local area surveys is that level of trust is above the national in one area, five are within two percentage points of the national, and three are below, with two markedly below: Logan, a suburb of Brisbane, recorded 18%, and the Atherton Tablelands, also in Queensland, recorded 16%.
Table 7: ‘How often do you think the government in Canberra can be trusted to do the right thing for the Australian people?’ Response: ‘almost always’, ‘most of the time’. 2012–13, Percentage
|
Greater Dandenong (Melbourne) 2012
|
Fairfield (Sydney) 2012
|
Mirrabooka (Perth) 2013
|
Bankstown (Sydney) 2012
|
Hume (Melbourne)
2012
|
Logan (Brisbane) 2013
|
|
31.4
|
28.2
|
27.8
|
26.0
|
22.6
|
18.0
|
|
Shepparton (Victoria) 2013
|
Murray Bridge (SA) 2013
|
Atherton Tablelands (Qld) 2013
|
|
27.1
|
22.4
|
16.1
|
Source: Scanlon Foundation
Findings compared
Are the levels of trust—and the pattern of decline—found in the Scanlon Foundation surveys replicated in other surveying? The answer is yes on both counts.
The Australian Election Study conducted by researchers at the Australian National University asks if ‘people in government can usually be trusted to do the right thing?’ It recorded a decline of nine percentage points between 2007 and 2013; the Scanlon Foundation survey showed a decline of 12 percentage points over these years.[6]
The Gallup World Poll included Australia and recorded a fall in trust between 2007 and 2012 of 11 percentage points; for these years the Scanlon Foundation survey recorded almost the same proportion, 13 percentage points.
Levels of trust recorded in several Australian surveys in 2013 produced similar results: 27% in the Scanlon Foundation survey, 28% in a survey conducted for the University of Melbourne Centre for Advancing Journalism, 34% in the Australian Election Study.
Interpreting the findings
How are these findings on the level of trust in the federal government to be interpreted? Has there been a substantive change in the level of trust in the Australian political system?
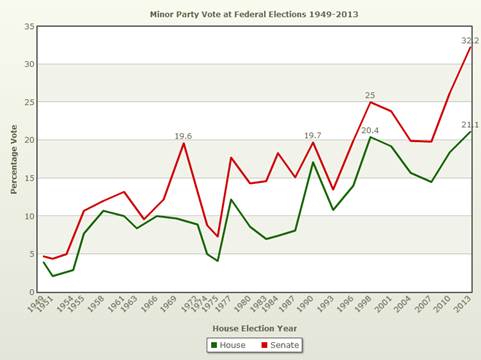
One unambiguous data source is voting in federal elections. The record indicates a decline in the vote for the major parties, increasing support for minor parties and independent candidates. These results may point to growing distrust of the party system, a pillar of Australian democracy.
Antony Green’s analysis of the Senate vote shows that since 1949, on two occasions the minor party vote was close to 20% (1969, 1990), in 1998 it reached 25%, and in 2013 registered the highest proportion, 32%, almost one in three voters.
A similar pattern is evident in the recent House of Representative vote, but in 2013 the minor party vote, while the highest since 1949, was only marginally above the 1998 level.
Figure 2: Minor party vote at federal elections 1949–2013
Source: Anthony Green’s Election Blog, ABC Elections, 19 November 2013, http://blogs.abc.net.au/ antonygreen/2013/11/record-vote-for-minor-parties-at-2013-federal-election.html
The Sydney-based Lowy Institute conducts surveys that focus on foreign policy, but include questions of domestic relevance. In 2012 and 2013 respondents were presented with three statements about democracy and asked ‘which one of the three statements comes closest to your own personal views about democracy’:
1. ‘Democracy is preferable to any other kind of government’
2. ‘In some circumstances, a non-democratic government can be preferable’
3. ‘For someone like me, it doesn’t matter what kind of government we have’
In 2012, 60% of respondents indicated the first option, and in a preference that was interpreted as cause for unease, 23% indicated agreement with the second option, that ‘in some circumstances a non-democratic government can be preferable’, while close to 15% indicated the third, that ‘it doesn’t matter what kind of government we have’.[7] Almost identical results were obtained in the 2013 survey.[8]
These findings, which do not provide evidence on change over time, may nonetheless be used as an indicator of dissatisfaction with the Australian political system. What has been seen as a surprisingly high proportion, close to 40%, failed to provide unambiguous endorsement of democracy as the preferred form of government.
But there is scope for other interpretations, starting with a closer look at the response options provided.
There is a logic to a question which provides three response options by way of statements: such an approach encourages a division of opinion, rather than a strong endorsement of one option. Agreement at the 90% level is obtained by questions which provide just two response options, such as ‘yes’ or ‘no’, or by a Likert scale which provides four or five response options, with the top two responses (such as ‘strongly agree’ or ‘agree’) aggregated.
There is also scope for close examination of the response options in the Lowy survey: the second option, ‘in some circumstances, a non-democratic government can be preferable’, is not necessarily a rejection of democracy, it is a response conditional on the meaning attached to the qualifier ‘in some circumstances’.
The question used in the Lowy survey is one that was popular in the 1990s in cross-national research; over the last 15 years researchers have sought a more precise approach, asking for views on the appropriateness of democracy for the respondent’s own country—and whether democracy can solve the problems faced by the country. Such questions have been asked with a 10 or eleven point response scale.[9]
There is other, albeit limited, survey data available on the level of support for democracy in Australia.
The fifth wave of the World Values Survey conducted between 2005 and 2008 included a question on attitudes to a ‘democratic political system’. The proportion indicating the first level agreement, ‘very good’, was 58%, close to the first level of response obtained by the Lowy poll. A further 32% indicated ‘fairly good’, a combined 90%.
Of particular note, the distribution of Australian responses was almost identical with those obtained in New Zealand, Great Britain, and Canada, and whereas the 2012 Lowy Institute poll found stronger support for democracy in India than Australia, the pattern of differentiation between the two countries was not replicated in the World Values Survey.
Table 8: ‘I’m going to describe various types of political systems and ask what you think about each one. Please tell me if it would be very good, fairly good, fairly bad, very bad for the government of this country ... Having a democratic political system’. 2005–08, percentage
|
Sweden
|
Italy
|
NZ
|
Great Britain
|
Australia
|
Canada
|
India
|
US
|
China
|
Russian Federation
|
|
Very good
|
76.2
|
63.9
|
59.7
|
58.4
|
57.5
|
57.0
|
52.0
|
45.2
|
34.3
|
24.4
|
|
Fairly good
|
21.7
|
31.5
|
34.3
|
32.2
|
31.5
|
34.8
|
39.7
|
40.4
|
59.4
|
54.6
|
|
Fairly bad
|
1.7
|
4.0
|
3.4
|
5.8
|
8.0
|
5.3
|
5.9
|
10.7
|
5.2
|
16.2
|
|
Very bad
|
0.4
|
0.6
|
2.6
|
3.6
|
3.0
|
2.9
|
2.4
|
3.7
|
1.1
|
4.8
|
Source: World Values Survey, 2005–08
The democracy question was also included in the 1995 World Values Survey administered in Australia. The results obtained were close to the 2005 pattern, with a lower proportion indicating agreement at the highest level (‘very good’), and a higher proportion at the second level (‘fairly good’), a combined 87%.
Table 9: ‘Please tell me if it would be very good, fairly good, fairly bad, very bad for the government of this country ... Having a democratic political system’. Percentage
|
Australia 1995
|
Australia 2005
|
|
Very good
|
51.3
|
57.5
|
|
Fairly good
|
36.0
|
31.5
|
|
Fairly bad
|
9.0
|
8.0
|
|
Very bad
|
3.6
|
3.0
|
Source: World Values Survey
A key source of time-series data for determining shift in political opinion is the Australian Election Study. The AES includes questions on both trust and democracy.
With relevance for the hypothesis under consideration (there has been a substantive change in the level of trust in the Australian political system), the time-series data does not indicate a significant one-directional shift in opinion; rather, the finding is one of variability. Thus, dissatisfaction with democracy was at a peak in the second half of the 1970s, while current level of satisfaction matches that of 1998, 2001, and 2010. While in 2013 trust in people in government is relatively low, it is at the level of 1993, 1998, and 2001.
Australian democracy
Given the lack of unambiguous evidence of long-term decline of trust in the Australian political system, how are the findings obtained by the Scanlon Foundation and other surveys to be explained?
Figures 3 & 4: Australian Election Study, selected questions

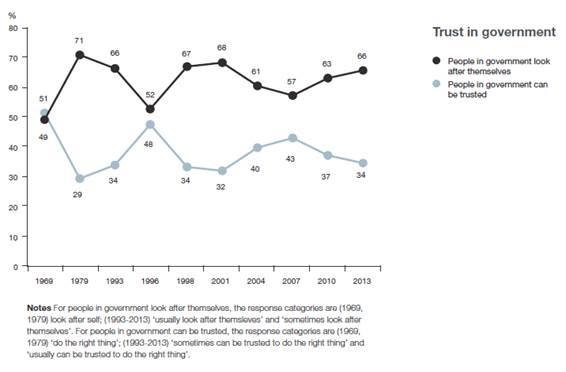
Source: McAllister and Cameron, Trends in Australian Political Opinion (2014), p. 47
While Australians indicate relatively high levels of belonging and pride in their country and its way of life, and similarly high levels of life satisfaction, they have relatively low levels of trust in politics and politicians. This may be linked to an Australian scepticism. A number of commentators have observed the Australian characteristic of cynicism; Australians are not great believers.
It is true that low levels of trust characterise public opinion in much of the western world. But it is a noteworthy finding that the Gallup World Poll in 2012 found the average confidence in national government within the OECD at 40%, while Australia, without the level of dislocation consequent on the Global Financial Crisis, recorded confidence in government at just a marginally higher 42%.
The World Values Surveys conducted in the 1990s (Australia 1995) included questions on attitudes to nine institutions. A tabulation of results by Rodney Tiffen and Ross Gittins found that the mean score for the nine institutions in a cross-country analysis which comprised sixteen European countries and the USA and Canada yielded an average of 49%, while the average for Australia was 44%.[10]
In 1995, 31% of Australians indicated a ‘great deal’ or ‘quite a lot’ of confidence in parliament, compared to 48% in France, 46% in the United Kingdom and 38% in Canada. In the 2005–08 World Values Survey, the Australian level of confidence in parliament was little changed, at 34%. Just 14% indicated confidence in political parties.
Consistent with this pattern of response, when in 2013 the Scanlon Foundation survey asked Australians to rank nine institutions or organisations in terms of levels of trust and confidence, institutions of Australian democracy ranked at the bottom.
The highest level of trust or confidence was in hospitals, police, public schools, and employers, followed by the legal system and television news. Trade unions, federal parliament and political parties were lowest ranked.
Indication of ‘a lot of trust’ ranged from 53% for hospitals and the police to 9% for trade unions, 7% for federal parliament, and 3% for political parties.
In late 2013, after the federal election, the Edelman Trust survey asked Australians ‘how much do you trust government leaders to tell you the truth, regardless of how complex or unpopular’. Just 7% responded ‘a great deal’.[11]
Table 10: ‘I’m going to read out a list of Australian institutions and organisations. For each one tell me how much confidence or trust you have in them in Australia’. 2013, percentage
|
‘A lot of trust’
|
‘Some trust’
|
‘Lot’+ ‘some’
|
|
Hospitals
|
53
|
35
|
88
|
|
Police
|
53
|
34
|
87
|
|
Public schools
|
42
|
42
|
84
|
|
Employers
|
23
|
53
|
76
|
|
Legal system
|
23
|
44
|
67
|
|
TV news
|
11
|
50
|
61
|
|
Trade unions
|
9
|
40
|
49
|
|
Federal parliament
|
7
|
39
|
46
|
|
Political parties
|
3
|
36
|
39
|
Source: Scanlon Foundation
In a survey of recent arrivals, also conducted in 2013 by the Scanlon Foundation, immigrants were asked to indicate levels of institutional trust. In a finding that may indicate that with increased length of residence immigrants learn the negative views of parliament and political parties in the land of their adoption, those who arrived more recently (between 2000 and 2010) have a more positive view than those who have been here longer.
Table 11: ‘Below is a list of Australian institutions and organisations. Please indicate, for each one, how much or how little trust you have in them in Australia?’ Response: ‘a lot of trust’, ‘some trust’. Percentage
|
Arrived 2000–10
|
Arrived 1990–99
|
|
Federal parliament
|
30.9
|
21.3
|
|
Political parties
|
20.9
|
14.6
|
Source: Scanlon Foundation
Evidence of lack of trust and the low ranking of politicians is not difficult to find. Since the 2013 election, Essential Report has on two occasions (November 2013, March 2014) asked respondents to rank attributes that fit the Liberal and Labor parties; fifteen attributes were specified, including the view that the party ‘keeps its promises’ and is ‘trustworthy’.
For the recently elected Liberal Party, the attribute that it keeps its promises was ranked 13 out of 15; ‘trustworthy’ was ranked 14. For Labor, ‘keeps its promises’ ranked 15, ‘trustworthy’ ranked 13.
The top ranked attribute for both parties was: ‘will promise to do anything to win votes’.
Table 12: Attributes of political parties: ‘which statements do you feel fit the Liberal Party/Labor Party’, selected statements, percentage
|
Liberal
|
Labor
|
|
5 Nov 2013
|
25 March 2014
|
5 Nov 2013
|
25 March 2014
|
|
Will promise to do anything to win votes
|
63
|
67
|
63
|
63
|
|
Out of touch with ordinary people
|
56
|
59
|
53
|
49
|
|
Have good policies
|
46
|
44
|
41
|
44
|
|
Has a good team of leaders
|
46
|
43
|
31
|
34
|
|
Keeps its promises
|
39
|
35
|
36
|
30
|
|
Trustworthy
|
35
|
32
|
29
|
31
|
Source: Essential Media Communications, Essential Report, 25 March 2014, http://essentialvision.com.au/documents/essential_report_140325.pdf, pp. 5–6
The substantive explanation for increase or decrease (from a low base) in the level of trust in the federal government is the electoral standing of the party in power.
For a brief period, Prime Minister Rudd galvanised the hopes and aspirations of a relatively high proportion of the electorate. His 73% approval rating in 2008 was the highest for any political leader that has been obtained by Newspoll; in March 2009, Nielsen recorded 74% approval. In September 2009, 67% preferred Kevin Rudd as prime minister, the Leader of the Opposition, Malcolm Turnbull, was preferred by 19%. When the Rudd Labor government was perceived not to be delivering on its promises, the level of approval crashed—and did not recover under Prime Minister Gillard.
Using Scanlon Foundation survey data, the following table correlates level of trust in the federal government and support for the Labor Party, the party in government across the 2009–13 Scanlon Foundation surveys. Over this period trust in the federal government declined by 21 percentage points from its peak in 2009; the level of support for Labor declined by almost the same proportion amongst survey respondents. With the decline occurring in tandem, the difference between support for Labor and trust in the federal government remained within six percentage points in the surveys between 2009 and 2012. One interesting feature of this analysis is that while support for Labor rose sharply amongst survey respondents in 2013, there was no corresponding rise in the level of trust in government.
Using a different data set, the Edelman Trust Barometer reaches a similar conclusion: ‘Over time, Australia’s trust in government appears to fluctuate in line with Australia’s electoral cycle, particularly changes in the country’s leadership ... Australians are fickle’.[12]
Table 13: Trust in the federal government and level of support for the Labor Party. Percentage
|
Trust
|
Vote Labor
|
Variance (percentage points)
|
|
2007
|
39.0
|
|
|
|
2009
|
47.6
|
42.6
|
5.0
|
|
2010
|
31.4
|
29.3
|
2.1
|
|
2011
|
30.5
|
25.1
|
5.4
|
|
2012
|
26.2
|
20.1
|
6.1
|
|
2013
|
27.2
|
32.3
|
(5.1)
|
Source: Scanlon Foundation
The alignment of the level of trust in government and political identification is further indicated by correlating trust with intended vote—thus in 2013, 43% of Labor voters indicated trust in the federal government, compared with just 19% of Liberal voters.
Table 14: ‘How often do you think the government in Canberra can be trusted to do the right thing for the Australian people?’ Response: ‘almost always’, ‘most of the time’, by intended vote. Percentage
|
Labor
|
Liberal
|
|
2009
|
61
|
34
|
|
2010
|
51
|
20
|
|
2011
|
49
|
20
|
|
2012
|
49
|
16
|
|
2013
|
43
|
19
|
Source: Scanlon Foundation
There may not be much that can be done to markedly improve trust in the Australian political system. But we do have understanding of the factors that determine approval above the base level. The Edelman organisation has articulated the strategy for business to build trust. Much of the strategy has direct applicability to government. It includes:
Engagement
Listen to needs and feedback; communicate frequently and honestly on issues of national significance.
Integrity
Ethical conduct of individuals in government—and legislative policies which are seen to be ethical; ethical administrative practice; take responsible actions, transparently and openly.
Purpose
Addresses social needs; work to protect and improve the environment; create programs that positively impact the community.
Operations
Have highly-regarded and widely admired top leadership; deliver consistently on policy undertakings.

Question — Thank you very much for that talk which was fantastically insightful into trying to understand why such large numbers of Australians are distrustful of our politicians. Where I would disagree with you is that I think the way to really come to grips with that is to do it through focus group research. It is incredibly expensive and would entail very large numbers of people but BIS Shrapnel did that in 1998 and it was paid for by insurance companies and banks and so forth who were just trying to work out the attitudes of Australian towards financial products and where they were going to invest. They had high quality people teasing out what was the underlying concerns of these thousands of Australians and what they discovered was a profound reaction against neo-liberalism, privatisation, deregulation and user-pays and that was what was really underlying and driving the Hanson phenomena and the reductions of the tariffs in Victoria driving the Cleary phenomena. Coupled with that we have also had this phenomena of politicians starting with Blair and with Clinton and this era of spin in which you get up and say one thing and go off and do something else. This combination of spin and implementing an economic agenda which was not really in the interest of a lot of Australians and which a lot of Australians profoundly disliked.
Andrew Markus — That was an interesting comment but with respect you are approaching this from the point of view that you know the answer. If we asked you to write down what can politicians do to make things work, you gave us nearly 10 points there. What I am trying to do is to understand at a macro level how different societies operate. You are not going to achieve that by doing focus groups because they are macro questions and you can’t answer macro questions with micro methodology. Nonetheless, I am not saying that qualitative research and focus groups are not very important but it is a different terrain and what I have tried to indicate to you is that by long-run data analysis you can understand the trends and changes in societies. Now why exactly that is occurring—you are giving us some of the answers and your understanding of why they are occurring, whereas I am answering more in macro issues. Not necessarily what governments do but how they do it, how they communicate, are they abiding by their promises and, where we touch on the same term, are they meeting real needs? I think what you were saying was governments were not meeting real needs, they were not meeting expectations.
Question — We used to have a political party that ran on the catch phrase ‘keeping the bastards honest’ and then every time there was an election they wouldn’t respect whoever won power and wouldn’t let them implement their policies. They would always want to bargain or say no. Isn’t that a problem all round the world? How do you get political parties to accept election outcomes and vote according to what the majority of the population said? Until you change the system, you are always going to get a constant 40 per cent result here or overseas because people just get cynical. Does any country come up with a solution that if you go to an election and you win an election you actually get to do what you promised to do?
Andrew Markus — I think we all know what Winston Churchill said about democracy—something along the lines of it is a pretty bad system but it’s the best one we’ve found so far. It is an imperfect system, and you understand my approach to it. As I have been doing this research and as I try to engage with public opinion over the last 10 years what I have been impressed by is that there is a stability and a coherence that can be upset by a huge economic crisis. But what we want to do is to understand how Australian society functions. What are its strengths and what are its challenges? For me, we are not going to perfect it. We are not going to keep the bastards honest. It is not going to happen. But we can produce leadership that goes that much above the base, or that goes that far below the base. So if it is 30 per cent we can get leadership that will go from 45 down to 15. We are not going to get 90. The people who have tried for the 90 have ended up with political systems that are actually worse than what they had before.
Question — I was wondering if you could comment on the possible effect of televising parliament. I am not sure when that came in but I was wondering whether making visible to the people the behaviour particularly at question time might be regarded as rather unedifying and might affect the trust issue.
Andrew Markus — The first thing you want to work out is how many people actually watch anything like that. Some people would catch it on the TV news where there would be brief excerpts but I don’t believe that many people would sit through televised parliamentary debates and so on. Run the hypothesis: the more we have actually shown people how politicians behave, the more it has turned people off. My answer is no, they were already turned off.
Question — One of the ways that recent developments in Australian politics has been described is ‘hyperpartisan’. That so much needs to be happening and seen only through the partisan lens. I was just wondering if you had any thoughts on that and whether there is any evidence that it is one of the factors in the trend that you noted in Senate votes towards independent and minor parties and away from the major parties.
Andrew Markus — When we first started getting this data which showed that there are lower levels of trust in the government in Canberra I was thinking along those lines. But then having to more carefully look at a whole range of data my answer is there haven’t been shifts that are out of the normal range. These sorts of explanations—this is what the politicians have done wrong and that has driven people to the third parties—I don’t think are really supported.
One of the issues has been that the business of government has become more complex. Would you not agree with me that in the last five years running government has been more difficult than it was in 2001? If for no other reason than the economic climate is so difficult and the recovery from the global financial crisis has been so difficult. So it has made it more difficult for politicians in Australia to deliver on people’s needs. Like infrastructure. We have a huge infrastructure deficit in Australia. And every year that we don’t deal with that in a systematic way it gets more difficult because the deficit grows. But it is difficult to fund those and people have tried various means of funding including government–private ownership partnerships and so on. But again, in the economic climate that we have in this country it is difficult to fund that. Not everyone will agree with that.
There is another view that says the money is all there you just have to run it properly. I don’t subscribe to that view. I think it is overly simplistic. Where you have these major crises of confidence and we look at history—because I am by training a historian—it is the economic crises that make it more difficult for governments to govern. It is huge levels of unemployment, youth unemployment, which drives those indicators in Italy and Greece and Spain. So for me that emergence of the third parties can be interpreted as a reflection of that reality that the existing parties for whatever reason are not delivering.
* This paper was presented as a lecture in the Senate Occasional Lecture Series at Parliament House, Canberra, on 11 April 2014.
[1] Essential Media Communications, The Essential Report, 11 February 2014, http://essentialvision.com.au/documents/essential_report_140211.pdf, p. 10.
[2] Scanlon Foundation, Mapping of Social Cohesion Surveys, http://www.scanlonfoundation.org.au/ research.html.
[3] OECD, Government at a Glance 2013, OECD Publishing, http://dx.doi.org/10.1787/gov_glance-2013-en, p. 21.
[4] Michael Bush, ‘Trust in government plunges to historic low’, 19 January 2014, http://www.edelman.com/news/trust-in-government-plunges-to-historic-low/.
[5] Jeffrey M. Jones, ‘Record-high 42% of Americans identify as independents’, Gallup Politics,
8 January 2014, http://www.gallup.com/poll/166763/record-high-americans-identify-independents. aspx.
[6] Ian McAllister and Sarah M. Cameron, Trends in Australian Political Opinion: Results from the Australian Election Study 1987–2013, Australian National University, Canberra, 2014, http://aes.anu.edu.au/publications/aes-trends.
[7] Fergus Hanson, ‘Lowy Institute Poll 2012: public opinion and foreign policy’, 5 June 2012, http://www.lowyinstitute.org/publications/lowy-institute-poll-2012-public-opinion-and-foreign-policy.
[8] Alex Oliver, ‘Lowy Institute Poll, 2013’, 24 June 2013, http://www.lowyinstitute.org/publications/ lowy-institute-poll-2013.
[9] Larry Diamond, ‘Introduction’, Journal of Democracy, vol. 21, no. 4, October 2010, p. 102.
[10] Rodney Tiffen and Ross Gittins, How Australia Compares, Cambridge University Press, Cambridge, England, 2004, p. 244.
[11] Edelman Trust Barometer, 2014 Annual Global Study (Powerpoint, summary report, at edelman.com).
[12] Edelman Trust Barometer, Trust in Asia Pacific, Middle East and Africa 2014 (at edelman.com), p. 13.
Prev | Contents | Next