Posted 27/03/2018 by Geoff Gilfillan
A statistical snapshot published by the Parliamentary Library in January 2018 analysed the characteristics and use of casual employees in Australia. The Australian Bureau of Statistics has since released estimates for casual and permanent employees for 2017 as well as revised figures from 2004 to 2016 to reflect the most recently available population estimates collection. The series has also been adjusted to reduce the impact of seasonal and other irregular effects on employment estimates.
This Flagpost provides information on growth in the number of casual and permanent employees in Australia between August 2004 and August 2017 and the casual employee share of total employees and total employment.
Casual employees do not have access to paid leave entitlements such as holiday and sick pay whereas permanent employees have access to these entitlements. To compensate for lack of access to paid leave entitlements, casual workers are paid a loading that is set between 15 and 25 per cent (depending upon the award or enterprise agreement) on top of the normal hourly wage rate.
Trends in number of casual employees and their share of total employees and employment
Despite small falls in 2005 and 2012, there was relatively steady growth in the number of casual employees between 2004 and 2014, followed by much stronger growth between 2014 and 2016.
Chart 1 - Number of Casual employees in Australia - August 2004 to August 2017
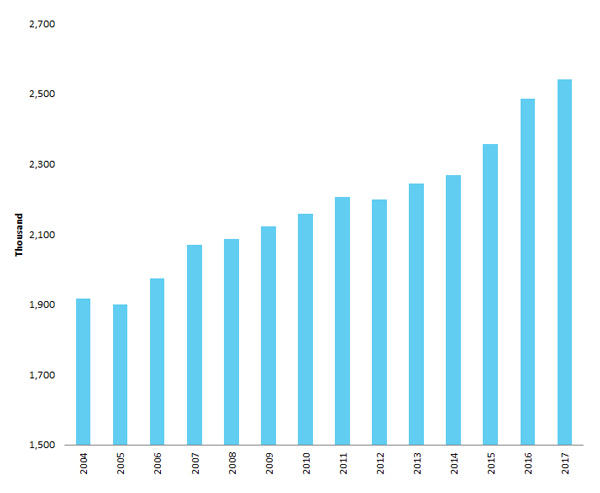
The number of casual employees grew by an annual average of 3.8 per cent between 2014 and 2017 compared with an annual average growth rate of 1.7 per cent between 2004 and 2014 (using a compound annual growth rate).
In contrast, the number of permanent employees has grown by an annual average of 1.5 per cent between 2014 and 2017, compared with an annual average of 2.6 per cent in the previous ten years.
However, the data also shows more balanced growth of both casual and permanent employment in the 12 months to August 2017, with both forms of employment growing by 2.2 per cent.
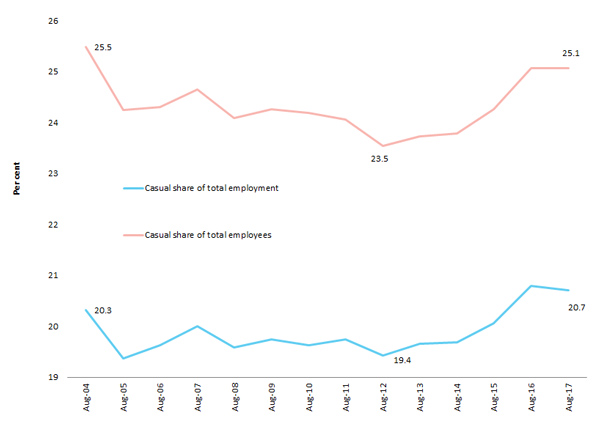
These labour market trends have contributed to an increase in the casual share of total employees from 23.5 per cent in 2012 to 25.1 per cent in 2017. Despite recent strong growth in the number of casual employees, the casual share of total employees is still below the rate of 25.5 per cent recorded in 2004.
The casual employee share of total employment stood at 20.7 per cent in August 2017—up slightly from a share of 19.4 per cent in 2012—and similar to the share of 20.3 per cent recorded in August 2004. Total employment includes owner managers of incorporated and unincorporated enterprises as well as employees with and without leave entitlements.
Chart 2 - Casual employee share of total employees and total employment
Casual employee shares by state and territory
Queensland and South Australia had casual employee shares of total employees that were well in excess of the national average—at 29.0 per cent and 27.5 per cent respectively in August 2017. Casual shares were much lower than the national average in the Northern Territory and the ACT.
Chart 3 - Casual employee share of total employees by state and territory - August 2017
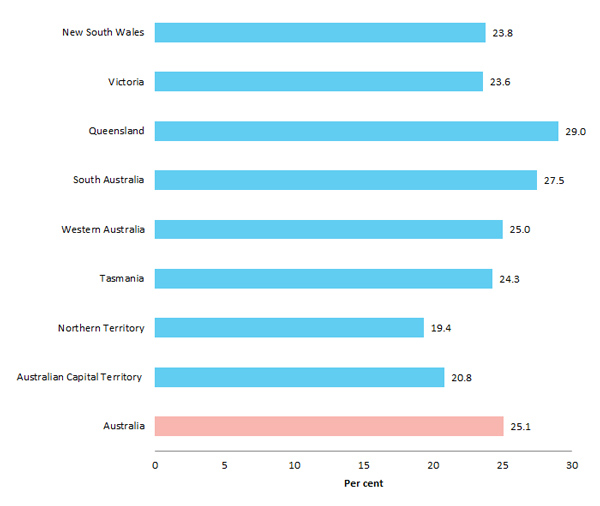
Differences in casual shares among states and territories can reflect higher rates of casual employment than the national average in particular industries or higher concentrations of employment in industries more likely to be characterised by casual employment.
The higher casual share in Queensland appears to be driven more by higher casual shares than the national average in particular industries including Construction; Transport, postal and warehousing; Health care and social assistance; Arts and recreations services; and Other services.
Conclusion
The ABS data shows that despite stronger growth nationally in casual employment between 2014 and 2016, casual employees have consistently accounted for close to a quarter of all employees and a fifth of all employed people between 2004 and 2017.