Posted 14/09/2017 by Alicia Hall
The Australian Bureau of Statistics (ABS) has just released selected results from their two-yearly Survey of Income and Housing in their publication Household Income and Wealth, Australia, 2015–16 (cat. no. 6523.0).
Household incomes
The ABS’ Survey of Income and Housing currently provides one of the best sources of data on trends in household incomes and income distribution in Australia. The data shows that, broadly speaking, real household incomes have remained reasonably stable between 2013–14 and 2015–16 (in 2015–16 dollars). Specifically:
- ‘average weekly equivalised [1] disposable[2] household incomes’ have fallen 1.9 per cent
- ‘median (that is, the midpoint) weekly equivalised disposable household incomes’ have fallen 2.0 per cent
- ‘average weekly gross household incomes’ have declined from $2,128 to $2,109 (0.9 per cent)
- ‘median weekly gross household incomes’ have increased from $1,596 to $1,616 (1.3 per cent)
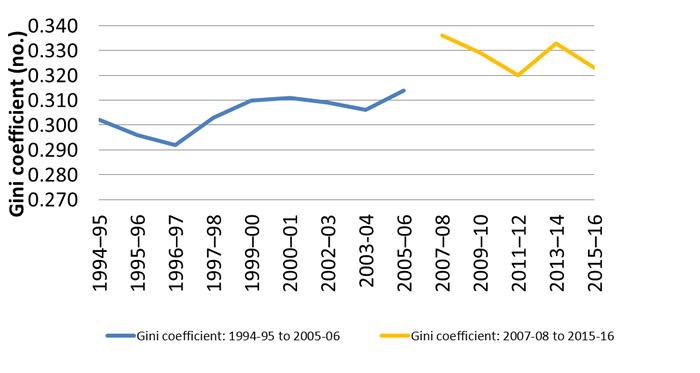
In terms of income distribution, the ABS publishes a summary measure of income inequality—the ‘Gini coefficient.’ The Gini coefficient is a value between zero and one, where zero represents perfect equality and one perfect inequality.[3] The 2015–16 data shows household income inequality has also remained steady between 2013–14 and 2015–16 (moving from 0.333, to 0.323). If we look at changes from 2007–08 (when ABS reports that results are directly comparable to data for later years) to 2015–16, we can see the Gini coefficient has not changed significantly over the period, ranging between 0.320 (2011–12) and 0.336 (2007–08). The share of income held by each of the income quintiles has increased from 2007–08, except for the highest quintile, which has dropped.
The following graph shows the Gini coefficient for income since 1994–95. In this context, it is important to note there have been changes to the measurement of household income in the survey over time, with estimates presented for 2007–08 onwards ‘not directly comparable’ with estimates for previous years.
The ABS’ Gini coefficient for income is consistently higher than that reported in the Melbourne Institute’s Household, Income and Labour Dynamics in Australia (HILDA) survey which has ‘remained at approximately 0.3 over the entire 15 years of the HILDA survey.’ (2017 Statistical Report, p. 29) Peter Whiteford has indicated ‘the reasons for the differences between the findings of the ABS and the HILDA survey are not obvious.’
Household wealth
The ABS has collected comprehensive data on household wealth and wealth distribution as part of its Survey of Income and Housing since 2003–04. Prior to this, data on wealth distribution was largely limited to taxation statistics, the HILDA survey (with wealth data collected for the first time in 2002) and ABS data on owner occupied housing.
Average household wealth in Australia has increased in real terms since 2013–14, from $835,300 to $929,400 in 2015–16 (11.3 per cent). Median household wealth is much lower; however, it has also increased, from $476,000 to $527,000 (10.7 per cent).[4]
The Gini coefficient can also be used to measure wealth inequality. This shows that wealth inequality has increased slightly, from 0.573 in 2003–04 to 0.605 in 2015–16 (the same as for 2013–14). The HILDA Survey reports a slightly higher Gini coefficient for wealth, increasing from 0.624 in 2002 to 0.626 in 2014 (2016 Statistical Report). Since 2003–04, the proportion of wealth held by each of the wealth quintiles has declined, except for the highest wealth quintile.
If we examine average household wealth by wealth quintile, we can see the highest wealth quintile holds roughly 80 times the wealth of the lowest wealth quintile. However, if we look at average household net wealth by equivalised disposable household income quintile, the highest income quintile holds roughly 3.8 times the wealth of the lowest household quintile. This is indicative of changes in income and wealth over a life-cycle, with older people often having higher wealth levels (particularly through property ownership) and lower incomes.[5]
Related publications
A further publication, Housing Occupancy and Costs, 2015–16 (cat. no. 4130.0) also based on the Survey of Income and Housing, is currently scheduled for release on 13 October 2017. Key findings from the Household Expenditure Survey (Household Expenditure Survey, Australia: Summary of Results, 2015–16 (cat. no. 6530.0)), which is a sub-sample of the Survey of Income and Housing, and the Housing Occupancy and Costs publication will be addressed in separate Library Flagposts.
[1] Equivalisation is the process of adjusting household incomes for different compositions and sizes to enable comparison between different households. The ABS advise that: ‘For a household comprising more than one person, equivalised income is an indicator of the household income that would be required by a lone person household in order to enjoy the same level of economic wellbeing as the household in question.’ As such, it cannot be viewed as the disposable income of an ‘average household’.
[2] Disposable incomes are after income tax has been removed. Gross incomes are pre-tax.
[4] These figures are not equivalised. Equivalising household wealth is less important than it is for household income, as it is often built up over a long period, and household composition often changes significantly over this period.
[5] See P Whiteford,
Income and Wealth inequality: How is Australia faring?,
The Conversation, March 5 2014.