This Flagpost article aims to present Australia’s current debt position and how it has changed since prior Flagposts on Australia’s debt position. This Flagpost updates the latest available data on Australia’s level of debt for both the public and private sectors in gross and net terms, and compares it with previously published data. For definitions of gross and net debt the reader is referred to the Library’s earlier Flagpost titled
.
Chart 1 below presents Australia’s current foreign debt for the March quarter of 2013 in gross and net terms for the public and private sectors. From Chart 1 it is clear that the private sector is still the largest contributor to Australia’s foreign debt. The private sector is responsible for 78.8 and 71.9 per cent of Australia’s gross and net foreign debt respectively. This is a decrease of 4.0 and 7.8 percentage points of gross and net foreign debt respectively since the December 2010 quarter – the first quarter after the election of the Gillard government.

General government, as defined by the Australian Bureau of Statistics (ABS) comprises of all of all government units (local, state and national governments) and non-profit institutions controlled and mainly financed by the government. The general government gross and net foreign debt currently stands at 14.8 and 23.9 per cent of Gross Domestic Product (GDP) respectively. This is an increase of 4.0 and 8.0 percentage points in gross and net foreign debt respectively since December 2010. The total Australian public sector (including general government, and financial and non-financial corporations controlled by governments) gross and net foreign debt currently stands at 21.2 and 28.1 per cent of GDP respectively, an increase of 4.0 and 7.8 per cent of GDP respectively since December 2010.
Although the private sector gross and net foreign debts have decreased since December 2010, the public sector gross and net foreign debts have increased. This has resulted in Australia’s total gross foreign debt (aggregate of the public and private sectors) as a proportion of GDP increasing by 2.2 percentage points since December 2010 to 95.5 per cent of GDP. Australia’s total net foreign debt as a proportion of GDP has increased 2.5 percentage points since December 2010 to 50.9 per cent of GDP.
Chart 2 presents the national government (the Commonwealth) gross and net debt position for years spanning 1970–71 to 2016–17. Data for 2012–13 and onwards are estimates based on expected GDP and debt growth as outlined in Budget Paper No 1 2013–14. The national government gross and net debt currently (2011–12) stands at 18.3 and 10.0 per cent of GDP respectively. National government gross and net debt has increased 6.1 and 6.7 percentage points respectively since 2009–10. These debt figures are composed of all foreign and domestic liabilities, including financial and non-financial corporations, for the national government.

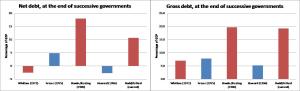
To gain an insight into what this actually means for the national government’s overall financial health, hence its current debt position, it is helpful to compare these data with previous governments and that of other countries. Chart 3 presents gross and net debt for successive national governments spanning Whitlam to the current Rudd/Gillard Government with red indicating Labor governments and blue representing Coalition governments. The levels of debt recorded in Chart 3 reflect what the gross and net debt positions were at the end of each term of government, except for the Rudd/Gillard period where the most current data has been reported.
Sources: 1901-1949: Vamplew, W., Australian historical statistics GF8-14 (public debt series) p.257 multiplied by 0.002 to convert from thousands of Australian pounds into millions of Australian dollars,
1950-1995: RBA Occ Paper no. 8 Historical stats -Commonwealth Government Securities on Issue, 1995-2000: RBA table e10 - Commonwealth Government Securities on Issue, 2001-2012: Budget final outcome, Commonwealth Securities on Issue, 2013-2017: Budget Paper No 1 - Commonwealth Government Securities on Issue (estimated/projected), 1901-1959: Vamplew, W., Australian historical statistics ANA 119-129 (GDP, current prices series) p.139, 1960-2012: ABS, Annual National Accounts, cat.no. 5204.0 Table 2, 2013-2017: Budget Paper No 1 - Commonwealth Government Securities on Issue (estimated/projected nominal GDP growth rates applied)
In gross and net terms the current Rudd/Gillard government has recorded the second largest debt position of all previous governments over the reporting period with only the Hawke/Keating government experiencing a higher debt position.
Chart 4 presents general government gross and net debt for Australia in 2012 compared with other countries. The term general government used here is from the International Monetary Fund and is defined as all entities that fulfil the function of the government as their primary activity. Chart 4 clearly shows that Australia’s general government gross and net debt, which currently stand at 27.2 and 11.6 per cent of GDP respectively, are much lower than those of other countries.
Source: International Monetary Fund, World Economic Outlook Database, April 2013.
Combining this with historical data, it becomes clear that Australia’s current debt position, in both gross and net terms, is still very low despite the increases documented above.