Introductory statement
I, Rob Stefanic, as the accountable authority of the Department of Parliamentary Services (DPS), present the 2015—16 annual performance statements of DPS, as required under section 39 (1)(a) of the Public Governance, Performance and Accountability Act 2013 (PGPA Act). In my opinion, these annual performance statements accurately reflect the performance of the entity, and comply with section 39 (2) of the PGPA Act.
Purpose
DPS supports the functions of the Australian Parliament and the work of parliamentarians through the provision of professional services, advice and facilities, the ongoing maintenance of Australian Parliament House (APH); and makes the building, and the important activity that takes place within it, accessible.
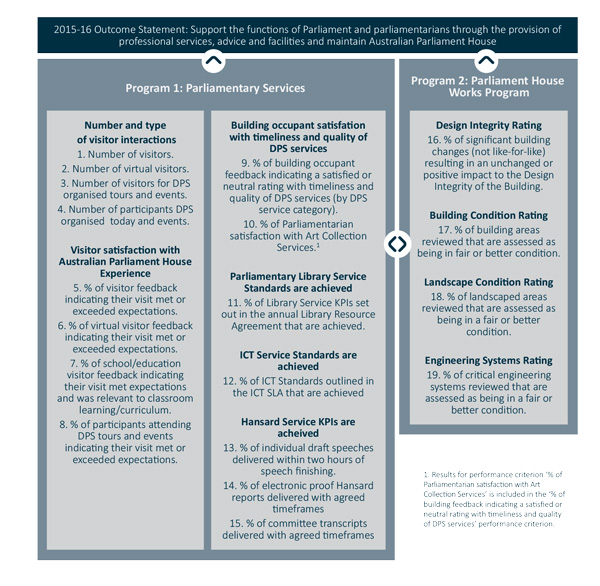
DPS 2015—16 strategic measures map
Results
Performance criterion 1—number and types of visitor interactions
DPS is the custodian of APH which is the working symbol of Australian democracy and a significant destination for our citizens and international visitors alike. APH is an iconic building of national and international significance and part of DPS’ purpose is to make the building, and the important activity that takes place within it, accessible to the public. Visitors to APH are encouraged to view proceedings of both the Senate and House of Representatives from the public galleries or via the ParlView website to witness democracy in action.
DPS measures visitor numbers for four types of visitor interactions which reflect the different modes of access to the building and the activities that take place. These are:
- number of visitors to APH
- number of virtual visitors
- number of visitors for DPS educational (school) tours, and
- number of participants to DPS organised tours and events.
Criterion source
- Program 1, 2015–16 Portfolio Budget Statement (PBS), p14
- Program 1, 2015–19 Corporate Plan, p11.
Results against performance criterion
Target – Equivalent or greater to same period last year
|
|
2013–14
results
|
2014–15
results
|
2015–16
results
|
|
Number and types of visitor interactions
|
|
|
|
|
Number of Visitors
|
677,932
|
759,483
(720,759)4
|
725,992
|
|
Number of virtual visitors
|
3,500,000
|
3,979,949
|
4,706,404
|
|
Number of visitors for DPS educational tours5
|
123,5076
|
132,7816
|
127,292
|
|
Number of participants to DPS organised tours and events7
|
-
|
-
|
74,829
|
|
Participants in general public tours
|
66,696
|
55,893
|
-8
|
|
Participants in other tours
|
7,622
|
7,384
|
-9
|
|
Number of functions and events in Parliament House10
|
|
|
|
|
Official visits
|
15
|
37
|
-
|
|
Parliamentary
|
327
|
331
|
-
|
|
Non-parliamentary
|
703
|
813
|
-
|
4 720,759 is the adjusted 2014–15 visitor number based on the 2015–16 methodology.
5 Number of visitors for DPS educational tours was reported as ‘Participants in school tours’ in previous years. This performance measure has been renamed ‘Visitors for DPS school tours’ in the 2016–17 PBS to reflect more accurately the type of visitors and the nature of their visitor experience. Specifically that they are visitors from schools, and DPS does not provide ‘educational’ tours. (The provision of educational services is the role of the Parliamentary Education Office in the Department of the Senate).
6 In 2013–14 and 2014–15 this figure was reported as ‘Visitors for DPS school tours’. The methodology for reporting the numbers is the same as ‘educational’ tours.
7 Number of participants to DPS organised tours and events includes public tours, other tours and event numbers.
8 Figures for Participants in general public tours in 2015–16 are included in DPS organised tours and events.
9 Figures for Participants in other tours in 2015–16 is included in DPS organised tours and events.
10 Number of functions and events held in Parliament House is not a key performance indicator and is not reported in the Annual Performance Statements.
Methodology
In previous years, reported visitor numbers have included pass holders entering APH through the main foyer. In 2015–16 a more accurate method of calculation was adopted to not include pass holder numbers. This is intended to ensure the results more accurately reflect visitor numbers to APH rather than occupancy numbers.
Participant numbers for tours and events were reported separately in previous years and the events data included events bookings taken by an external provider. In 2015–16 DPS has applied one key performance indicator (KPI) to focus only on DPS organised tours and events participants.
Analysis
Visitor Numbers
Based on the new method of calculation the APH visitor numbers increased in 2015–16 by 0.7 per cent.
Virtual Visitor Numbers
Virtual visitor numbers are calculated using the number of ‘hits’ on the ‘Visit Parliament’ webpage. Our virtual visitor numbers continue to grow. The new DPS Visit Parliament website will launch in August 2016 and will incorporate a new design and refreshed content for our online visitors.
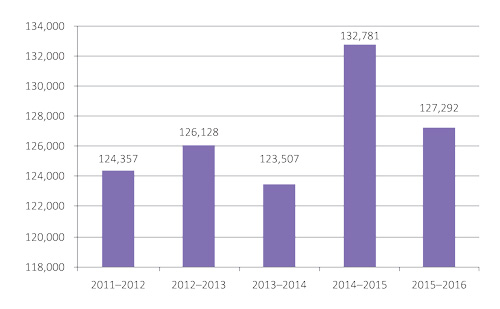
School (Educational) Tours
School tours of APH are available to all primary and secondary Australian schools. Bookings are managed by the Serjeant-at-Arms office in the Department of the House of Representatives. The number of participants in school tours is down from last year by 5,489 (4.3 per cent). The year to year comparison for this performance measure does not consider seasonal variations in visitation such as the spike in 2014–15 due to the Centenary of World War I. Longer term statistics (2011–16) demonstrate a higher long-term average for annual schools visitation.
*Annual schools visitation figures include students, and teachers, carers and accompanying parents.
There are a number of potential factors, beyond the control of DPS, which may have impacted on school visitation to Canberra. These include a two-year cyclic school visitation, the Parliament and Civics Education Rebate (PACER) for schools not increasing with the Consumer Price Index and variation of capacities at other PACER institutions. There are two barriers to increasing schools visitation that DPS is working with stakeholders to address:
- inconsistent levels of awareness among teachers of the PACER rebate and how it can be accessed, and
- low level of promotion of the PACER rebate to schools by the managers of the rebate scheme.
To help improve this measure for 2016–17 DPS will resource a social media campaign and contribute to National Capital Educational Tourism Project (NCETP) collaborative marketing.
DPS organised tour and event participants
In 2015–16 DPS offered a number of free and paid tours and events at APH. To provide a comparison between the participants for 2015–16 and 2014–15, the 2014–15 figures were aggregated resulting in a total of 68,857 participants. There has been an increase of 5,972 participants (8 per cent) from 2014–15 to 2015–16.
DPS conducted a number of tours and events at APH during 2015–16, which were well received by visitors.
Daily tours
APH visitors participated in a number of daily tours in 2015–16 including:
- Welcome Tours – guided tours which are offered five times a day, introduce visitors to the most significant features of APH. The tours include a visit to the Chambers of Parliament on non-sitting days and viewing of the extensive APH Art Collection on show, including in the Great Hall, the Marble Foyer and the Members’ Hall, and
- Discovery Tours – behind-the-scenes tours which are offered three times a day, offer visitors an exclusive chance to visit some of the private spaces of APH. Visitors have the opportunity to stand beneath the Australian flag to hear of the events that have shaped Australia and the unique building of APH. During sitting days, the Discovery Tours are offered, but access to the private spaces is not available.
Seasonal and subject-based tours
- APH visitors participated in various tours and events held in 2015–16, these included:
- Spring Glory Tours in September and October 2015, which focused on the hidden courtyards and landscapes of APH. These tours highlighted the courtyards and House of Representatives and Senate sides of the building. They also featured the springtime foliage of the large and small trees in the courtyards of APH
- Autumn Glory Tours in March 2016, which highlighted the spectacular changing landscape in the hidden courtyards of APH
- Feel the Heritage Tours in April 2016, an interactive and memorable behind-the-scenes experience for visitors that focused on some of the hidden spaces and treasures of APH, featuring the architecture, furniture and design
- The Magna Carta Tours from June to December 2015 and the Anzac Day weekend in April 2016. Visitors learned of the influence and impact the Magna Carta had and continues to have on Australian democracy, and its associated effect on the Constitution, Federal and State laws, and
- World War I Tour – To our last man and our last shilling – Parliament at War. During the 100th anniversary of World War I, visitors to APH had the opportunity to explore the impact of the war on the Parliament, its work, its people who served and its work during conflict.
Orientation tours
DPS also conducted orientation tours for building occupants throughout 2015–16.
The performance measure of comparing months across years does not consider anomalous visitation or the election cycle. In 2016–17 DPS will undertake a review of the tour KPIs to address these anomalies in the targets for the 2017–18 reporting period.
DPS is also continuing to develop a social media campaign to bolster future school bookings. Given the lead time
required to coordinate school bookings, this is anticipated to affect visitor figures in late 2016–17 and into 2017–18. DPS will increase marketing partnerships with NCETP and other institutions to increase visitation to the region in 2016–17.
Performance criterion 2—visitor satisfaction with the APH experience
DPS aims to offer high-quality and innovative programs to enhance our visitor experience and community engagement, making APH a destination of choice and a showcase for the products of our region. Regular and ongoing feedback is essential to understanding visitor satisfaction with the APH experience.
Criterion source
- Program 1, 2015–16 PBS, p15
- Program 1, 2015–19 Corporate Plan, p11.
Results against performance criterion
Target – 85% satisfaction
|
|
2013–14
results
|
2014–15
results
|
2015–16
results
|
|
Visitor satisfaction with Australian Parliament House Experience
|
|
|
|
|
% of visitor feedback indicating their visit met or exceeded expectations
|
-
|
-
|
97.40%
|
|
% of virtual visitor feedback indicating their visit met or exceeded expectations
|
-
|
-
|
81.00%
|
|
% of school/education visitor feedback indicating their visit met expectations and was relevant to classroom learning/curriculum
|
-
|
-
|
99.50%
|
|
% of participants attending DPS tours and events indicating their visit met or exceeded expectations
|
-
|
-
|
99.30%
|
|
Visitor satisfaction
|
|
|
|
|
Visitor services – tours and information, the Parliament Shop and visitor catering, building access and parking
|
75.00%
|
84.74%
|
-11
|
|
Website
|
65.00%
|
65.49%
|
-12
|
11 % of visitor feedback indicating their visit met or exceeded expectations was reported as Visitor services – tours and information, the Parliament Shop and visitor catering, building access and parking in previous years.
12 % of virtual visitor feedback indicating their visit met or exceeded expectations was reported as Website in
previous years.
Methodology
A new method of collecting and reporting visitor satisfaction with their experience at APH was introduced in 2015–16. DPS used multiple mechanisms to measure visitor satisfaction including comment cards (general visitor, school tours and tours) and TripAdvisor comments.
Analysis
At 97.4 per cent, DPS achieved a high level of visitor satisfaction in 2015–16. This was also evident from the TripAdvisor awards received this year including 2016 Travellers’ Choice Top 10 Landmarks —Australia: #9 Australian Parliament House, and #3 of 180 things to do in Canberra.
Throughout 2015–16 DPS put strategies in place to increase visitor feedback such as electronic feedback collection and school tour feedback steadily increased over 2015–16 as a result. School tour satisfaction results of 99.5 per cent demonstrate that these tours are highly valued by participants. The successful introduction of electronic feedback means this will be extended to include other visitor feedback in 2016–17 to provide an accurate observation of visitor feedback as a result of increased feedback numbers.
Virtual visitor satisfaction was 81 per cent for 2015–16, 4 per cent down from the target of 85 per cent. Virtual visitor feedback continues to be limited, with only 115 virtual visitors providing feedback. DPS has developed a new Visit Parliament web presence, which includes an improved visitor survey to measure satisfaction. The new Visit Parliament web presence will be launched in late 2016. It will incorporate a new design and refreshed content for our online visitors, and it is anticipated this will lead to an increase in both numbers of virtual visitors who provide feedback, as well as an improved customer experience for our virtual visitors, which will translate to increased rates of virtual visitor satisfaction.
DPS tour and event visitor satisfaction achieved a high result for 2015–16 of 99.3 per cent. Visitor satisfaction is measured through comment cards provided to participants at the end of a tour or event. Visitors are asked to rate their experience from 1 to 5 with 1 being ‘poor’ and 5 being ‘excellent’. Visitors are also given the option to provide comments at the bottom of the cards.
A sample of visitor comments for tours and events held in 2015–16 appears below:
Welcome Tour
- Maggie was filled with so much information and answered all the questions asked. She has a great speaker’s voice; it keeps you listening and very informal.
- We joined a guided tour with Nicola as our tour guide. She was excellent, very knowledgeable and personable. She respected and responded to all the tour participants. I was very impressed. Thank you.
- Neil was an outstanding tour leader - knowledgeable & thoughtful with just the right amount of humour. We learnt a lot about Parliament House & our system of government.
- This tour was hugely informative, educational and entertaining. Our guide Kevin was very knowledgeable and kept my 15, 13 & 8 year engaged throughout. It was wonderful to have this free service.
- Many thanks Marie for sharing your wealth of knowledge of Parliament house and the Parliamentary systems. The tour 'flew!' We gained much knowledge from your presentation!
- Excellent! Eric presented a lot of information very clearly and affable. A thoroughly enjoyable and educational tour.
- The public tour was fantastic. Our tour guide Heather made the visit very interesting and accessible to all- we would definitely recommend the tour to others.
- Very beautiful, modern building. Your guide David extremely knowledgeable. In all a great experience.
- Stephen our guide brought this to life- a building + experience we are proud of.
- Probably the most entertaining tour I've done. Andrew made what could have been a very dry tour quite captivating.
Magna Carta Tour
One of the most informative tours I've ever had. Catherine was terrific!! We enjoyed ourselves immensely.
Discovery Tour
- Tour was absolutely wonderful! Gina very knowledgeable and humorous. Gave great detail and made an already lovely building come alive.
- Shane gave a wonderful tour and was very engaged with the group. Spoke very clearly, passionately and took into consideration the language level of our group. Help Desk were also very helpful and attentive.
Spring Glory Tour
- Rosie’s spring garden tour was very interesting, enjoyable & informative. We would recommend to friends & acquaintances - only hope it continues to be held. Friendly & helpful staff everywhere! Memories of a very pleasant visit. Thank you.
Performance criterion 3—building occupant satisfaction with timeliness and quality of DPS services
DPS is responsible for the delivery of a broad range of services directly and through facilitated arrangements.
To continue to improve our services, it is important to gauge building occupant satisfaction with the timeliness and quality of DPS services.
Criterion source
- Program 1, 2015–16 PBS, p15
- Program 1, 2015–19 Corporate Plan, p11.
Results against performance criterion
Target – 75% satisfaction
|
|
2013–14
results
|
2014–15
results
|
2015–16
results
|
|
Building Occupant Satisfaction
|
|
|
|
|
% of building occupant feedback indicating a satisfied or neutral rating with
timeliness and quality of DPS services
|
-
|
-
|
89.40%
|
|
Breakdown by service category
|
|
|
|
|
Food and beverage/catering services
|
-
|
-
|
75.80%
|
|
Retail/sporting services
|
-
|
-
|
92.70%
|
|
Maintenance/cleaning services
|
-
|
-
|
89.50%
|
|
Security services
|
-
|
-
|
94.10%
|
|
Parliamentary reporting and recording services
|
-
|
-
|
95.90%
|
|
ICT services
|
-
|
-
|
94.40%
|
|
Visitor/Art services
|
-
|
-
|
83.30%
|
|
ICT Services (ICT emails)
|
97.00%
|
95.00%
|
-
|
|
Hansard (ANAO/DPS survey results)
|
-
|
97.00%
|
-
|
|
Broadcasting (ANAO/DPS survey results)
|
-
|
97.00%
|
-
|
|
Security (ANAO/DPS survey results)
|
-
|
91.00%
|
-
|
|
Building maintenance (ANAO/DPS survey results)
|
-
|
75.00%
|
-
|
|
Other services (ANAO/DPS survey results)
Cleaning
Gardens and Landscaping
Art Services
Heritage Management
|
-
|
87.00%
94.00%
75.00%
69.00%
|
|
Methodology
The survey differed from previous years where parliamentarians were surveyed once per Parliament. The Australian National Audit Office (ANAO) and DPS conducted a joint survey in relation to DPS services in 2014–15, in which all 226 parliamentarians were invited to participate and 33 responded.
DPS developed and conducted the annual building occupant satisfaction survey in April 2016.
Participants included:
- senators and members
- staff of senators and members
- staff of the Department of the Senate
- staff of the Department of the House of Representatives
- staff of the Parliamentary Budget Office, and
- staff of DPS.
The purpose of the survey is for DPS to gain a better understanding of the changing needs of parliamentarians, their staff and other building occupants and receive regular feedback on the services and facilities that we provide.
The first survey was conducted over three working weeks. It contained 22 questions asking DPS’ clients to rate (anonymously) their level of satisfaction with DPS managed services, and provide any comments or suggestions as to how the services could be improved.
Analysis
DPS received 519 responses to the survey from a distribution list of approximately 5,500 email addresses, which is a return of 9.4 per cent.
The target for building occupant satisfaction with timeliness and quality of DPS services target is 75 per cent.
This target was achieved for all service categories in the 2016 survey.
Food and beverage services
Food and beverage services were broken down into four categories:
- Staff Dining Room
- Queen’s Terrace Café
- Coffee Cart, and
- Catering.
Food and beverage services received 356 comments, some of them very extensive, in addition to the satisfaction ratings. The majority of feedback was in relation to the Staff Dining Room and the Queen’s Terrace Café, with much of it negative. Common themes raised in the feedback were:
- poor food quality / lack of fresh food / food overcooked
- lack of variety, both daily and over time
- unreasonable prices
- lack of consistency in portion sizes
- poor layout of the serving areas
- poor quality of the pre‐made sandwiches, and
- slow service.
Retail and sporting services
Retail and sporting services were broken down into six categories:
- The Parliament Shop
- banking
- physiotherapist
- hairdresser
- travel agent, and
- gym and sporting facilities.
Retail and sporting services recorded 217 comments providing feedback on these services. Consistent with the high satisfaction ratings, the comments were mostly positive. There were nevertheless many suggestions to improve the services. Common themes raised in the feedback were:
- longer opening hours for the Health and Recreation Centre
- The Parliament Shop has a limited range of products and is too expensive
- request for a pharmacy, and
- more variety of banking facilities (ATMs).
Visitor and art services
Visitor and art services were broken down into three categories:
- building tours for staff and constituents
- exhibitions and displays (including artwork in general circulation areas), and
- artwork provided in parliamentarians’ offices from the Parliament House Art Collection.
Visitor and art services recorded 107 comments, although many of those comments (35.2 per cent) were against a rating of ‘No’ or ‘Not applicable’. The remainder of comments were mostly positive, especially in relation to the Visitor Services Officers. Common themes raised in the feedback were:
- knowledgeable and helpful staff, and
- access for the public to more of the APH art collection.
Maintenance and cleaning services
The building services that were surveyed included:
- gardens and landscaping
- cleaning of your Parliament House office/work area
- cleaning of other Parliament House facilities
- maintenance of your Parliament House office/work area, and
- maintenance of Parliament House generally.
Maintenance and cleaning services recorded 235 comments. The majority of the feedback received was in relation to cleaning. Common themes raised in the feedback were:
- cleanliness of toilets/bathrooms
- increase the number of times vacuuming is carried out
- amount of cobwebs and moths in corridors and offices
- carpet wear and tear
- skylight under flagpole leak, and
- blinds and window sills not dusted enough.
Security services
Security services recorded 169 comments, many of which show appreciation of the DPS security staff and their polite, professional and helpful manner, while some comments reported the opposite experience. Other common themes raised in the feedback were:
- pass screening queues at all entry points, including checking passes at the entrances to the private car parks on mornings of sitting days, and
- security guards often talking amongst themselves or on a mobile phone.
Parliamentary reporting and recording services
Services that were surveyed included:
- parliamentary reporting (Hansard) services – timeliness
- parliamentary reporting (Hansard) services – accuracy, and
- audio‐visual (broadcasting) services (including house monitoring).
Parliamentary recording and reporting services received 117 comments, although a high number of these (29 per cent) were ‘No comment’ or ‘Not applicable’. Common themes raised in the feedback were:
- a perception of a reduction in the quality/accuracy and timeliness of Hansard over the past few years, and
- the professionalism, helpfulness and reliability of broadcasting staff.
Information and communication technology (ICT) services
Services that were surveyed included:
- ICT equipment and services
- 2020 helpdesk – timeliness, and
- 2020 helpdesk – adequate resolution.
ICT services recorded 139 comments. Common themes raised in the feedback were:
- improvement in service from 2020 over the past year
- slowness of the network and internet in Parliament House
- equipment not replaced or upgraded often enough
- lack of knowledge of all the systems that are used
- frustration with the restrictions of IT security, and
- after-hours support for staff of senators and members.
The results of the survey, including both satisfaction ratings and individual comments, were provided to the relevant DPS Assistant Secretaries and action plans have been developed in response. These action plans will be tracked by the Executive Committee over the coming year.
The survey results also indicate a need to re-examine the targets for this measure, as the results achieved indicate the target of 75 per cent satisfaction is too low and could be lifted.
Performance criterion 4—Parliamentary Library KPIs are achieved
The Parliamentary Library Service metric is an index to captures all of the service standards or key performance indicators for the Parliamentary Library that are approved by the Presiding Officers in the Library’s Annual Resource Agreement.
Criterion source
- Program 1, 2015–16 PBS, p15
- Program 1, 2015–19 Corporate Plan, p12.
Results against performance criterion
Target – 90%
|
|
2013–14
results
|
2014–15
results
|
2015–16
results
|
|
% of Library Service Standards
|
|
|
|
|
% of Library Service KPIs set out in the annual Library
Resource Agreement that are achieved
|
-
|
-
|
93.30%
|
Methodology
The office and functions of the Parliamentary Librarian are established by the Parliamentary Service Act 1999 (sections 38A and 38). Key priorities and performance indicators for the Parliamentary Library are approved each year by the Presiding Officers as part of Library’s Annual Resource Agreement (Parliamentary Service Act 1999, section 38G).
The KPIs measure the:
- percentage of clients using the Library’s services
- customer satisfaction
- number of completed client requests
- number of publications produced
- number of online uses of the Library’s publications
- attendance at training courses and events
- timeliness of research and library services
- number of items added to the Library’s Electronic Media Monitoring Service (EMMS) and ParlInfo databases
- number of new titles added to the catalogue
- percentage of the collection available on line, and
- use of the Library’s collections and databases and media portal.
The Library uses the RefTracker Information Request Management System to manage client requests and other client related work. This provides a rich array of client related data, including number of requests, usage, and timeliness. Satisfaction data is derived primarily from a formal evaluation of the Library’s services conducted once in every Parliament, the most recent being undertaken in 2015. Data regarding the number of publications produced and the number of items added to the EMMS and ParlInfo Search databases is obtained from ParlInfo Search. Data relating to visits to the Library client portal (intranet) are captured by Sitecore’s engagement analytics. The Parliamentary Library currently uses Urchin Web Statistics/Analytics software to analyse web statistics for use of publications and collection items. (This is being decommissioned and will be replaced by Splunk, another web-analytics application, in 2016–17.) A manual count is used to report on attendance at training courses and events and new titles added to the Library catalogue. Reports generated from the Integrated Library System provide information regarding the percentage of titles in the Library’s collection available online in full-text. Statistics on the
use of the Library’s collections and databases is formulated from Integrated Library System reports, Urchin data and vendor provided usage statistics.
Analysis
In 2015–16 the Library met the majority of its key performance indicators, the key exception being client satisfaction, where it achieved a rating of 93 per cent against its target of 95 per cent. It slightly exceeded its target of completing 13,000 client requests, recording 13,113 completed requests––an increase over the number achieved in the previous two years. The Library met its client usage target of 100 per cent (consistent with the previous financial year); and received two client complaints (again, consistent with the previous financial year).
In regard to the Library’s research service, it achieved its timeliness target of 90 per cent. It produced 267 publications, meeting its target (260) but considerably fewer than in the preceding two years. (This reflects in part the effect of the May dissolution of Parliament but also the increased focus on training and professional development activities in response to the findings of the 2015 evaluation of Library services.) The Library recorded 6.74 million uses of its publications (target 5.4 million); and 729 people attended training courses and events (target 500).
In regard to library collections and databases, over 177,600 items were added to the EMMS service and ParlInfo databases (target 150,000), an increase over the previous two years; and over 7,300 new titles were added to the catalogue (target 4,000). Eighty-nine per cent of clients used the media-portal (target 80 per cent). There were a little over 4.4 million uses of the Library collection and databases, very slightly decreased from 2014–15 but meeting the KPI of 4.4. The percentage of the Library’s collection available online increased to 41.2 per cent (target 40 per cent). In regard to timeliness, the 100 per cent target was met for the urgent new titles added to the Library’s catalogue; and the Library recorded 94.7 per cent against its timeliness target of 95 per cent for new titles added to the EMMS and newspaper clippings databases.
Detailed discussion of the Library’s performance is contained in the Parliamentary Librarian’s Annual Report which is included in the DPS Annual Report, as required by section 65 (1)(c) of the Parliamentary Service Act 1999.
Performance criterion 5—ICT service standards are achieved
The ICT Service Standard is an index composed of 15 individual performance criteria. Each criterion measures the delivery of key services in support of the effective and efficient operations of the Parliament, the parliamentary departments and APH.
Criterion source
- Program 1, 2015–16 PBS, p15
- Program 1, 2015–19 Corporate Plan, p12.
Results against performance criterion
Target – 90%
|
|
2013–14
results
|
2014–15
results
|
2015–16
results
|
|
% of ICT Standards
|
|
|
|
|
% of ICT Standards outlined in the ICT SLA that are achieved
|
-
|
-
|
91.66%
|
|
% of calls answered in 30 seconds
|
85.00%13
|
93.5014
|
-
|
|
IT services-incident resolution
|
93.00%
|
96.10%
|
-
|
13 Previously reported in 2013–14 as Help Desk calls (answered before 30 seconds).
14 Previously reported in 2014–15 as Help Desk calls (answered before 30 seconds).
Analysis
‘Calls answered in 30 seconds’ and ‘IT services-incident resolution’ which were reported in 2013–14 and 2014–15 are now two of the 15 individual criteria in the ICT Service Standards.
While the overall measure was achieved for the year, some individual criterion targets were missed in some months
and appropriate corrective actions were undertaken. It has been identified that a number of the criterion targets requiring 100 per cent availability do not reflect the nature of the services that rely on mechanical equipment, such as telephone handsets, that need to be maintained or replaced, making 100 per cent unachievable. To reflect this, targets will be adjusted to 99 per cent for 2016–17.
All 15 individual criteria are outlined below along with an explanation of their performance for the year.
|
Individual criterion
|
Comments
|
Target achieved
|
|
Broadcasting Services
|
This criterion requires that the target availability for the Chamber Sound Reinforcement, Division Bells and Lights, Clocks and ‘Live to Air’ broadcasts is 100 per cent during sitting times.
|

|
|
Chamber services
|
This criterion measures the availability of specific systems used by the chamber departments to ensure the effective and efficient operation of the parliamentary chambers. These systems include the Table Office Production System, Dynamic Red and Live Minutes and the target average availability of these systems is 100 per cent during sitting periods.
|

|
|
Customer Engagement Model
|
A customer request is a ‘request’ for a new solution (application or hardware) that is currently not part of the DPS existing service offering. This criterion requires that 100 per cent of customer requests are responded to within six days of lodgement and that 100 per cent of customer requests have undergone a detailed assessment within a timeframe agreed to with the customer.
|
|
|
Email
|
This criterion requires that the target average availability for email and mail exchange services provided by DPS is 99 per cent.
|
|
|
File and Print
|
This criterion requires the target availability for file and print services provided to our customers is 99 per cent.
|
|
|
First call resolution
|
This criterion requires that 70 per cent of calls to the ICT 2020 Service Desk are resolved on first contact.
|
|
|
Gateway availability
|
This criterion requires that gateway services are available 24 hours a day, seven days a week (excluding scheduled downtime). The target availability for gateway services is 99 per cent.
|
|
|
Incident resolution
|
This criterion requires that 95 per cent of all incidents reported to the ICT 2020 Service Desk are resolved within the agreed resolution times.
|
|
|
Information services
|
This criterion measures the availability of the EMMS and ParlView services. The target availability is 100 per cent. This criterion was not achieved. In 2015–16, a fault delayed new content from being published to both EMMS and ParlView over a three day period. Existing content was available and accessible. One report was received from a client who was unable to access the new content.
The target for this criterion will be amended to 99 per cent for the 2016–17 reporting year to reflect that this service does not have redundant infrastructure, so 100 per cent is not achievable.
|

|
|
Internet
|
This criterion requires that the target average availability of internet services for our customers is 99 per cent.
|
|
|
Mobile Device Management
|
A mobile device management application is used to provide security to mobile devices.
This criterion requires that this service is available 24 hours a day, seven days a week (excluding scheduled downtime).
|
|
|
PABX availability
|
This criterion requires that the target availability of the core telephone system (PABX) is 100 per cent.
|
|
|
Percentage of calls answered in 30 seconds
|
This criterion requires that 90 per cent of calls made to the ICT 2020 Service Desk are answered within 30 seconds.
|
|
|
Telephone – Technical
|
This criterion requires that each telephone handset is operational 24 hours
a day, seven days a week.
During one month a telephone card fault impacted 34 handsets within Parliament House.
The target for this criterion will be amended to 99 per cent for the 2016–17 reporting year to reflect the need to at times replace handsets and maintain mechanical components.
|
|
|
User accounts
|
This criterion requires that 100 per cent of all new user accounts are created within 24 hours.
|
|
During the 2015–16 reporting period 1,814 requests were received in total. During five months within the reporting period, processing delays resulted in a total of 27 user account requests not meeting the required target. The introduction of electronic notifications and improved escalation procedures has provided the ability to manage and monitor requests resulting in significant improvements in this area.
Performance criterion 6—Hansard service KPIs are achieved
DPS performs the critical and important function of recording and reporting of parliamentary activity through the Parliamentary Recording and Reporting Branch (PRRB). This measure demonstrates the importance of ensuring accurate and timely reporting of chamber and parliamentary committee proceedings through the production of Hansard.
Criterion source
- Program 1, 2015–16 PBS, p15
- Program 1, 2015–19 Corporate Plan, p12.
Results against performance criterion
Target
% of individual draft speeches delivered within two hours of speech finishing – 85%
% of electronic proof Hansard reports delivered within agreed timeframes – 95%
% of committee transcripts delivered within agreed timeframes – 95%
|
|
2013–14
results
|
2014–15
results
|
2015–16
results
|
|
Hansard Service KPIs
|
|
|
|
|
% of Individual draft speeches delivered within two hours of speech finishing
|
89.30%
|
86.50%
|
85.74%
|
|
% of electronic proof Hansard reports delivered within agreed timeframes
|
95.30%
|
94.40%
|
92.79%
|
|
% of committee transcripts delivered within agreed timeframes
|
100.00%
|
97.20%
|
92.90%
|
Analysis
One of the three service standards for Hansard production was achieved for the 2015–16 financial year; the other two were very close to the target. No systematic issues have been identified and reasons for the slight decrease in performance are explained below.
Of the 1,275 hours of chamber proceedings transcribed in 2015–16, PRRB delivered 85.74 per cent of individual draft speeches to senators and members within two hours of their speech finishing.
The agreed timeframe for publishing electronic proof chamber Hansard reports is three hours after the chamber rises. In 2015–16, 92.79 per cent (or 103 of 111) of electronic proof chamber Hansard reports met this publishing timeframe. There were six instances where, due to extended chamber sitting hours, a decision was made to part-publish the electronic proof chamber Hansard on the night and to complete and fully publish the proof Hansard the following day. The remaining two instances of not meeting the three-hour publishing deadline were as a result of technical issues.
The delivery of committee transcripts within agreed timeframes was down slightly from last financial year: 92.9 per cent in 2015–16 compared with 97.2 per cent in 2014–15. This was due to the continued high level of parliamentary committee hearings and PRRB adjusting its resourcing to meet the continued demand. Urgent committee transcripts were prioritised: 100 per cent of the 65 committee transcripts due within one business day of a hearing were delivered on time, 84 of the 86 (98 per cent) committee transcripts due within three business days of a hearing were delivered on time, and 91 per cent of the 461 committee transcripts due within five business days were delivered on time.
Performance criterion 7—design integrity rating
The Design Integrity Rating (DIR) attempts to measure the current condition of the design integrity of APH and the parliamentary precinct, expressed as a percentage of the original built form. In particular, it attempts to measure the extent to which change within the precinct impacts upon the original design.
The DIR methodology will be reviewed during 2016–17 due to concerns with its appropriateness as a measure of design integrity.
Criterion source
- Program 1, 2015–16 PBS, p16
- Program 1, 2015–19 Corporate Plan, p13.
Results against performance criterion
Target – 90%
|
|
2013–14
results
|
2014–15
results
|
2015–16
results
|
|
Design Integrity Rating
|
|
|
|
|
% of significant building changes (not-like-for-like) resulting
in an unchanged or positive impact to the Design Integrity of
the Building
|
89.40%
|
89.98%
|
89.75%
|
Note: scoring of zones in the building uses a weighted set of questions that address design criteria. As a result of this weighting there is a mathematical variance in the average scores due to the method of calculation used.
Methodology
The DIR is used to make an assessment about all projects completed within a reporting year for their consistency with the original design intent of APH.
In June 2016, two internal assessors undertook a building-wide assessment of all areas of the building and landscape. Due to the size of this task some spaces, including parliamentarians’ suites, basement plant rooms, administrative office areas and the courtyards are not inspected in their entirety. Sample areas are chosen at random each year and inspected as a representative sample of these larger areas. For the purpose of measuring the DIR, the precinct is divided into different zones. In each zone, the components of language, symbolism, design order, change and overall impression are inspected and scored using a weighted set of criteria given a score from one to five against an agreed set of criteria. The outcomes for each component are added together to obtain a zone score. The zone scores are combined to obtain a building score. This score is then expressed as a percentage of the total possible score.
Analysis
The overall DIR score for 2015–16 is 89.75 per cent, which is 0.23 per cent lower than the score for 2014–15, and just below the 90 per cent target.
The 0.23 per cent drop in 2015–16 was due to fluctuations in scoring within the zones. The building wide issues that negatively impacted the overall DIR rating include:
- removal and/or relocation of commissioned (Status A area) and global (Status B area) furniture from
design locations
- proliferation of ad hoc signage and inconsistent use of signage language, exacerbated by changed artificial lighting, and
- the wear and tear on the building fabrics, particularly during setup and dismantling for public functions
in the ceremonial spaces.
Positive impacts include uncovering of the skylight in the Great Hall, and new furniture for general office spaces
in the House of Representatives Wing.
Performance criterion 8—building condition rating
The Building Condition Rating (BCR) measures the current condition of the building fabric of APH, expressed as a percentage of the original condition. The BCR is determined by a visual inspection of the building and fabric surfaces for deterioration and damage caused by general wear and tear.
Criterion source
- Program 1, 2015–16 PBS, p16
- Program 1, 2015–19 Corporate Plan, p13.
Results against performance criterion
Target – 90%
|
|
2013–14
results
|
2014–15
results
|
2015–16
results
|
|
Building Condition Rating
|
|
|
|
|
% of building areas reviewed that are assessed as being in fair or better condition
|
88.50%
|
88.50%
|
88.45%
|
Analysis
The Building Condition Assessment Report (BCAR) delivered in 2014–15 identified a requirement for significant investment in the ongoing maintenance of APH to rectify deterioration to the building condition over its life, and, once an acceptable standard had been achieved, continue to maintain the building at a level that reflects APH’s status as a building of national significance. The BCAR identified the funding required to conduct this ongoing maintenance program, and additionally recommended that the BCAR should continue to support detailed plans
for the cyclical replacement of floor covering and repainting.
In 2015–16, more than 600 inspections were conducted throughout the eight zones of the building. For each area 34 building elements (carpet, furniture, painted surfaces, leather, lights, etc.) were assessed for each location with ratings attributed to these elements based on their actual condition. The resultant scores are then compiled in order to obtain the total BCR score. The BCR rating for 2015–16 was 88.45 per cent, 1.55 per cent below the target value of 90 per cent.
The same recording methodology has been used for the BCR for at least the past three years. This requires a single
person to allocate a score against each of the 34 building elements in an assessed area. Improvements to the building condition generated by the ongoing refurbishment and maintenance programs are offset by natural deterioration, caused by time, use and environmental factors.
While the net result of these positive and negative impacts is that the same BCR score has been recorded across
the last three years, it should be noted that the overall percentage rating does not accurately reflect the incremental effects of these impacts across the building. It does, however, reflect more accurately that the BCR assessments are cyclical by nature. That is to say, assessments are conducted across the building throughout the year and are not repeated in the same area during the reporting period. In addition, areas may be refurbished after they have been assessed.
The rating for 2015–16 was due to the expansion of building fabric refurbishment programs in the 2015–16 financial year, with an increase in repainting and flooring and tile replacements throughout APH. A number of other refurbishment works were carried out during the year, such as expansion joint and glazing repairs, external cleaning and building fabric maintenance and repairs which contributed positively to the score.
The ongoing refurbishment and maintenance programs include recarpeting, repainting, retiling, resurfacing, cleaning, refurbishing (furniture) and replacing lights. During 2015–16 successful performance of the scheduled works was affected by the unexpected recall of Parliament in the autumn recess. As a result, a number of planned programs of work were not able to progress. Lead times required to reschedule, particularly contracted work, meant these were subsequently unable to be completed before the end of the financial year. Once the required arrangements were in place, the tempo of maintenance works underway was significantly increased.
Performance criterion 9—landscape condition rating
The Landscape Condition Rating measures the current condition of the landscape surrounding APH.
Criterion source
- Program 1, 2015–16 PBS, p17
- Program 1, 2015–19 Corporate Plan, p13.
Results against performance criterion
Target – 90%
|
|
2013–14
results
|
2014–15
results
|
2015–16
results
|
|
Landscape Condition Rating
|
|
|
|
|
% of landscaped areas reviewed that are assessed as being in fair or better condition
|
81.00%
|
82.00%
|
83.00%
|
Methodology
For 2015–16 changes have been made to the assessment zones, in particular dividing the grass ramps into North and South and dividing the native peripheral gardens into three sections rather than treating them as one. This change in methodology allows for a more accurate assessment and will also better support more targeted remediation when required. This year the landscape was divided into 11 different zones.
Analysis
The Landscape Condition was assessed in November 2015. The landscape is assessed on individual criteria that include hard surfaces, trees, shrubs, turf and general appearance. The score for 2015–16 is 83 per cent, which is
a 1 per cent increase from the previous year.
The main reasons for the increase are:
- the front and back ramps were rated 100 per cent
- furniture and the fitness track in the peripheral gardens were restored in the period, and
- the turf was in better condition across the site.
Areas for improvement are:
- replanting in areas where shrubs have not been growing well
- resurfacing of tennis courts
- replacement of mature trees that are in poor condition for the location
- repair of some of the crushed granite paths and removal of a number of dead shrubs, and
- repair of broken pavers throughout the APH courtyards.
While the Landscape Condition Rating assessment did not meet the target of 90 per cent, the building occupant survey provided a satisfaction rating of 99.0 per cent for gardens and landscaping. This is reflective of both the high regard held for the APH landscaping by building occupants and the self-critical assessment by our landscape staff.
Performance criterion 10—engineering systems condition rating
The Engineering Systems Condition Rating (ESCR) measures the current operation and condition of the engineering systems in APH against the expected decline of those systems through their lifecycles.
Criterion source
- Program 1, 2015–16 PBS, p17
- Program 1, 2015–19 Corporate Plan, p13.
Results against performance criterion
Target – 90%
|
|
2013–14
results
|
2014–15
results
|
2015–16
results
|
|
Engineering Systems Condition Rating
|
|
|
|
|
% of critical engineering systems reviewed that are assessed as being in fair or better condition
|
88.60%
|
88.68%
|
88.73%
|
Analysis
The 2015–16 ESCR was 0.05 per cent higher than 2014–15.
Significant factors affecting the 2015–16 results were:
- the replacement of the landscape irrigation system controller
- the replacement of the landscape roof irrigation water supply pump
- the infrastructure improvement works completed have not had a significant impact on the installed portfolio of plant and equipment
- deterioration was identified in the increasing number of de-laminated glazing panels, particularly in the main skylight
- the Pneumatic Tube System, which is used to transport small documents, was rated lower in its end of life cycle (this system is now an approved project for replacement), and
- the Paint Store Water Mist System, which is an approved project for upgrading, has major compliance issues identified with the existing equipment type and cannot be upgraded ‘like for like’ due to component and area non-compliance with current fire regulations.
Analysis of performance against purpose
DPS’ outcome is to: Support the functions of Parliament and parliamentarians through the provision of professional
services, advice and facilities and maintain APH.
In support of this Outcome, DPS met 12 of the total 19 KPIs outlined in the 2015–16 PBS and 2015–19 Corporate Plan. Further analysis provides greater detail in relation to where DPS’ performance requires the greatest attention and efforts should be made for improvement. Despite the appearance of the overall result, there were also areas of strength across the department, and this is particularly so in relation to delivery of services.
|
|
2015–16 Target
|
2015–16 Results
|
Target achieved (Gap)
|
|
Number and types of visitor interactions
|
|
|
|
|
Number of Visitors
|
720,759
(equivalent of greater to the same period last year)
|
725,992
|
(+ 5,233)
|
|
Number of virtual visitors
|
3,979,949
(equivalent of greater to the same period last year)
|
4,706,404
|
(+726,455)
|
|
Number of visitors for DPS educational tours
|
132,781
(equivalent of greater to the same period last year)
|
127,292
|
(- 5,489)
|
|
Number of participants to DPS organised tours and events
|
New measure
(equivalent of greater to the same period last year)
|
74,829
|
(new measure)
|
|
Visitor satisfaction with Australian Parliament House Experience
|
|
|
|
|
% of visitor feedback indicating their visit met or exceeded expectations
|
85%
|
97.40%
|
(+ 12.4%)
|
|
% of virtual visitor feedback indicating their visit met or exceeded expectations
|
85%
|
81.00%
|
(- 4%)
|
|
% of school/education visit feedback indicating their visit met expectations and was relevant to classroom learning/curriculum
|
85%
|
99.50%
|
(+ 14.5%)
|
|
% of participants attending DPS tours and events indicating their visit met or exceeded expectations
|
85%
|
99.30%
|
(+ 14.3%)
|
|
Building Occupant Satisfaction with timeliness and quality of DPS services
|
|
|
|
|
% of building occupant feedback indicating a satisfied or neutral rating with timeliness and quality of DPS services
|
75%
|
89.40%
|
(+ 14.4%)
|
|
Breakdown by service category
|
|
|
|
|
Food and beverage/catering services
|
75%
|
75.80%
|
(+ 0.8%)
|
|
Retail/sporting services
|
75%
|
92.70%
|
(+ 17.7%)
|
|
Maintenance/cleaning services
|
75%
|
89.50%
|
(+ 14.5%)
|
|
Security services
|
75%
|
94.10%
|
(+ 19.1%)
|
|
Parliamentary reporting and recording
|
75%
|
95.90%
|
(+ 20.9%)
|
|
ICT services
|
75%
|
94.40%
|
(+ 19.4%)
|
|
Visitor/Art services
|
75%
|
83.30%
|
(+ 8.3%)
|
|
Parliamentary Library Service KPIs are achieved
|
|
|
|
|
% of Library Services KPIs set out in the annual Library Resource Agreement that are achieved
|
90%
|
93.30%
|
(+ 3.30%)
|
|
ICT Service Standards are achieved
|
|
|
|
|
% of ICT Service Standards outlined in the ICT SLA that are achieved
|
90%
|
91.66%
|
(+1.66)
|
|
Hansard Service KPIs are achieved
|
|
|
|
|
% of Individual draft speeches delivered within two hours of speech finishing
|
85%
|
85.74%
|
(+ 0.74%)
|
|
% of electronic proof Hansard reports delivered within agreed timeframes
|
95%
|
92.79%
|
(- 2.21%)
|
|
% of committee transcripts delivered within agreed timeframes
|
95%
|
92.90%
|

(- 2.1%)
|
|
Design Integrity Rating
|
|
|
|
|
% of significant building changes (not-like-for-like) resulting in an unchanged or positive impact to the Design Integrity of the Building
|
90%
|
89.75%
|
(- 0.25%)
|
|
Building Condition Rating
|
|
|
|
|
% of building areas reviewed that are assessed as being in fair or better condition
|
90%
|
88.45%
|
(- 1.55%)
|
|
Landscape Condition Rating
|
|
|
|
|
% of landscaped areas reviewed that are assessed as being in fair or better condition
|
90%
|
83.00%
|
(- 7%)
|
|
Engineering Systems Condition Rating
|
|
|
|
|
% of critical engineering systems reviewed that are assessed as being in fair or better condition
|
90%
|
88.73
|
(- 1.27%)
|
In addition to performance against KPIs, over the course of the year DPS, along with the other parliamentary departments, received other feedback in relation to performance, including from parliamentarians. In 2015–16 a number of senators and members paid tribute to the parliamentary departments and DPS collectively in their valedictory speeches in the 44th Parliament. The dot points below are drawn from Hansard transcripts.
- The Hon Bill Shorten MP – We rely on the hard work, good humour and boundless patience of the people who come to work here every day. The smooth running of this place depends on the calm civility of the clerks, the Serjeant-at-Arms and their office, the tabling office, the Parliamentary Library, Hansard and all of the attendants in this chamber. The kilometres of corridors around us house thousands more people without whom there would not be a Parliament. I refer, of course, to the guards, the plumbers, the printers, the switchboard operators, the caterers, the physios, the nurses and the IT support.15
- Ms Natasha Griggs MP - Thanks to the Parliamentary Services staff, to the House committee staff, to our security staff and of course to the Australian Federal Police who ensure our safety while we are here in Canberra.16
- The Hon Tony Burke MP - To the Hansard staff, depending on who is on their feet, your challenge is greater from time to time, but I acknowledge your work as I acknowledge the work of the Parliamentary Library.17
- Mr Russell Broadbent MP – I also thank our clerks team and the Deputy Clerk, Claressa Surtees; I particularly thank her for the help she has given me. There are the ministerial staff and government liaison officers; the Whip's office and their staff; the attendants, Luc and his team in the chamber; and those in the Library—angels of knowledge and accuracy, ably headed up by Dianne Heriot. There are the cleaners, the gardeners, the catering staff, Tim in the parliamentary dining room, the Hansard staff, the telephone operators, committee staff and support, our security team and particularly the AFP.18
A breakdown of performance across the two Programs delivered by DPS provides high level insight into the performance issues experienced during the 2015–16 year.
15 Commonwealth of Australia 2015, Parliamentary Debates: House of Representatives: official Hansard, pp14617.
16 Commonwealth of Australia 2015, Parliamentary Debates: House of Representatives: official Hansard, pp14800.
17 Commonwealth of Australia 2015, Parliamentary Debates: House of Representatives: official Hansard, pp14742.
18 Commonwealth of Australia 2015, Parliamentary Debates: House of Representatives: official Hansard, pp4632.
Outcome 1 – Program 1: Parliamentary Services
The objectives for the program were to provide:
- a range of research, information and reporting services to support the Parliament and the work of parliamentarians, and engage the community
- services to building occupants and electorate officers to enable them to conduct their work, and
- services and facilities for visitors to Parliament House.
DPS met 12 out of the 15 KPI against Program 1, a result of 80 per cent.
DPS has achieved the objectives and KPI targets through quality and consistent services to parliamentarians, building occupants and visitors to APH. DPS has undertaken a number of strategies to promote APH as an iconic building of national significance and tourist destination to increase visitors and visitor satisfaction, including seasonal tours and exhibitions. DPS is committed to enhancing digital access to information and the Parliamentary Library continues to be a trusted source of high quality information, analysis and advice.
These efforts are reflected in the areas in which DPS performed well over the period, which include visitor satisfaction, Parliamentary Library services, and ICT services. The Parliamentary Library achieved a result of 93.30 per cent. The Library met the majority of its key performance indicators with the major exception of client satisfaction, where it achieved a rating of 93 per cent, just slightly below the target of 95 per cent. The Building Occupant Survey indicated high levels of satisfaction with the majority of services provided by DPS to building occupants, notwithstanding there could be further work in relation to the targets for this measure.
While there have been some sound achievements, DPS acknowledges there is more work to be done to improve our performance, including consideration of the measures applied.
In addition to performance improvement, there were areas in which DPS did not perform to required levels and as a result did not achieve the targets for these measures. In each of these areas, specific activities have been undertaken or are under way to address the underlying issues that contributed to the failure to achieve the identified performance targets.
In addition to the KPIs for which targets were not met, DPS is also looking to improve performance in service delivery for 2016–17 more generally. In support of general performance improvement, DPS has undertaken or is undertaking the following activities:
- delivery of ICT Systems – the delivery of a long term strategy for ICT systems that support the operation
of the Houses
- professional development – professional development of DPS staff, in particular in relation to identified capabilities and delivery of service
- Food and Beverage Strategy and Retail Strategy – implementation of the agreed way ahead following receipt of food and beverage and retail strategy reports
- Feedback Policy – implementation of the DPS Feedback Policy, to enable DPS to continue to improve services
- Visitor Experience projects – progression of the Visitor Experience redevelopment projects, and
- parliamentary access – improve access to parliamentary proceedings (including captioning).
Outcome 1 – Program 2: Parliament House Works Program
The objectives for the program were to:
- strategically plan to maintain and upgrade Parliament House
- maintain Parliament House as a safe and accessible workplace and public building, and
- plan, develop and deliver physical security upgrades to Parliament House.
DPS did not meet the four key performance indicators against Program 2 in the 2015–16 PBS and the 2015–19 Corporate Plan.
A number of influences in 2015–16 have impacted on our ability to meet the KPI targets for this program. These include the impact of the unexpected recall of Parliament in the autumn recess following prorogation and the earlier budget sitting, on the maintenance timetable, and the construction related to the building security works which has had a range of impacts across APH. As a result, a number of planned programs of work were not able to progress. Lead times required to reschedule, particularly contracted work, meant these works were subsequently unable to be completed before the end of the financial year. Once the required arrangements were in place, the tempo of maintenance works under way was significantly increased.
In 2016, under the leadership of the new Secretary, appointed on 14 December 2015, DPS has developed a new framework for consultation on issues of design intent. The new framework will ensure the design intent of APH is restored and maintained, and will include consideration of how DPS’ performance in this area is measured.
To improve performance for 2016–17, DPS has undertaken or is undertaking the following activities:
- Design Intent Framework –a framework to assist DPS, as custodians of APH, to work respectfully in partnership with the building’s original designers to ensure its design integrity is restored and maintained
- Digital Asset Management System – an enterprise solution for digital asset management to be used for the photographic (AUSPIC) and art collections, archives and building information
- establishment of a Project Management Office –a project management office will be established in 2016–17 to facilitate the design, development and delivery of significant capital works activities
- Radio Frequency Identification Tags (RFID Tags) –RFID tags will be acquired and installed for all items in the APH Art Collection and all other assets
- strategic accommodation strategy – an accommodation strategy will be delivered to ensure that the Parliament’s needs can be met to 2040, and
- ongoing delivery of the DPS Capital Works Program –the Capital Works Program outlines an extensive program of work against a four-year rolling schedule.
Significant activities planned under this program include:
|
Project Name / Priority
|
Description
|
Timeframe
(estimated delivery date)
|
|
Strategic Accommodation
|
Deliver an accommodation strategy to ensure that the Parliament’s needs can be met to 2040
|
November 2016
|
|
Delivery of Security Upgrade Implementation Plan
|
Enhance the internal and external security arrangements to meet current and any future heightened security threat environment
|
October 2017
|
|
Upgrade of Emergency Warning and Intercommunication System (EWIS)
|
Replacement of the EWIS for Parliament House, which provides both audible and visual alarms to assist in the orderly evacuation of
the building.
|
June 2017
|
|
Carparking enhancement
|
Works to improve accessibility and way finding
|
June 2018
|
|
Emergency Generator Upgrade
|
Replacement of end-of-life emergency generators
|
June 2019
|
|
Fire systems
|
Passive fire audit and rectification
Fire Safety Strategy and Policy
Upgrade to the Fire Sprinkler Services to meet current standards
|
June 2019
June 2020
June 2019
|
|
Height safety
|
Relates to all WHS risks associated with working at heights together with any risk to staff or the general public created by areas exposed to heights
|
June 2018
|
|
Lift Systems Upgrade
|
End of life systems refurbishment and code compliance works
|
June 2020
|
|
Building Information
|
Capital works documentation updating and records management
|
June 2018
|
|
APH Preventative Maintenance
|
Ongoing building maintenance program to
ensure the continuing operation of the Parliament
|
Ongoing
|
DPS also conducted an internal audit into performance measures in late 2015–16 and identified a range of improvements that could be made, in particular to the Program 2, Parliament House Works Program performance criterion. These changes are being implemented in the 2016–17 financial year.