Posted 20/12/2013 by Alan Payne
Here we present a snapshot of Australia’s current debt position and how it has changed since the previously published articles on Australia’s debt position. This update provides the latest available data on Australia’s level of debt for both the public and private sectors in gross and net terms, and compares it with previously published data. For definitions of gross and net debt the reader is referred to the Library’s earlier Flagpost titled Australia’s current debt position from April 2011.
Chart 1 presents Australia’s current foreign debt for the September quarter of 2013 in gross and net terms for the public and private sectors. From Chart 1 it is clear that the private sector is still the largest contributor to Australia’s foreign debt. The private sector is responsible for 80.5 and 75.0 per cent of Australia’s gross and net foreign debt respectively. This is an increase of 1.7 and 3.1 percentage points of gross and net foreign debt respectively since the March 2013 quarter.
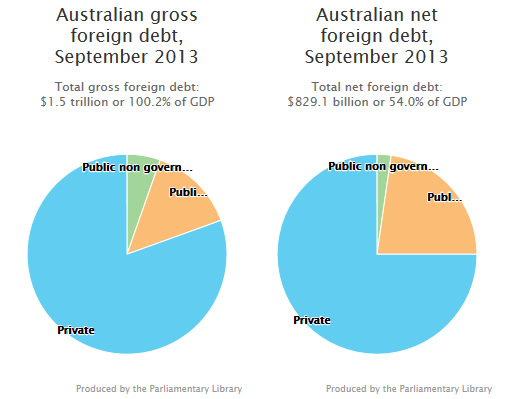
General government, as defined by the Australian Bureau of Statistics (ABS) comprises all government units (of local, state and national governments) and non-profit institutions controlled and mainly financed by the government. The general government gross and net foreign debt currently stands at 14.1 and 12.3 per cent of Gross Domestic Product (GDP) respectively. There has been no change in the gross debt, but there has been an increase of 0.1 per cent in net debt as a percentage of GDP since March 2013. The total Australian public sector (including general government, and financial and non-financial corporations controlled by governments) gross and net foreign debt currently stands at 19.5 and 13.5 per cent of GDP respectively. Gross and net foreign debt has decreased 0.7 and 0.8 percentage points respectively since March 2013.
The private sector gross and net foreign debts as a per cent of GDP have increased since March 2013, and the public sector gross and net foreign debts have decreased since March 2013. Combined, this has resulted in Australia’s total gross foreign debt (aggregate of the public and private sectors) as a proportion of GDP increasing by 4.7 percentage points since March 2013 to 100.2 per cent of GDP. Australia’s total net foreign debt as a proportion of GDP has increased 3.1 percentage points since March 2013 to 54.0 per cent of GDP.
Chart 2 presents the Commonwealth’s gross and net debt position for years spanning 1970–71 to 2016–17. Data for 2013–14 and onwards are estimates, based on expected GDP and debt growth. The national government gross and net debt currently (2012–13) stands at 18.8 and 10.1 per cent of GDP respectively. National government gross and net debt has increased 6.6 and 6.8 percentage points respectively since 2009–10. These debt figures are composed of all foreign and domestic liabilities, including financial and non-financial corporations, for the national government.
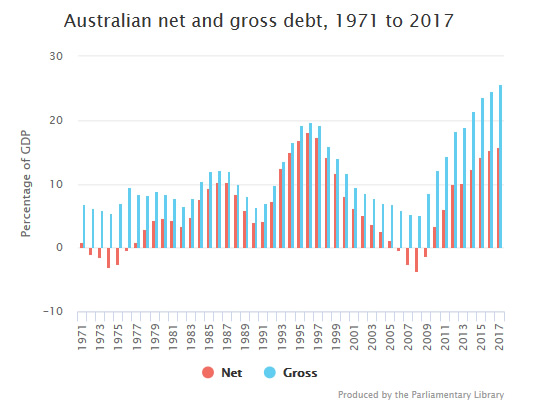
Sources: Gross debt-1971-1995: RBA Occ Paper no. 8 Historical stats - Commonwealth Government Securities on Issue, 1995-2000: RBA table e10 - Commonwealth Government Securities on Issue, 2001-2013: Budget final outcome, Commonwealth Securities on Issue, 2014-2017: 2013-14 Mid-Year Economic and Fiscal Outlook - Commonwealth Government Securities on Issue (estimated/projected), 1971-2012: ABS, Annual National Accounts, cat.no. 5204.0 Table 2, 2014-2017: Mid-Year Economic and Fiscal Outlook (estimated/projected nominal GDP growth rates applied). Net debt- 2013-14 Mid Year Economic and Fiscal Outlook.
To gain an insight into what this actually means for the national government’s overall financial health, it is helpful to compare these data with previous governments and that of other countries. Chart 3 presents gross and net debt for successive governments spanning Whitlam to the Rudd/Gillard/Rudd Governments. The levels of debt recorded in Chart 3 reflect what the gross and net debt positions were at the end of each term of government. The most recent forecasts for gross and net debt figures for 2013-14 onwards indicate that both are expected to rise during the term of the Abbott Government.
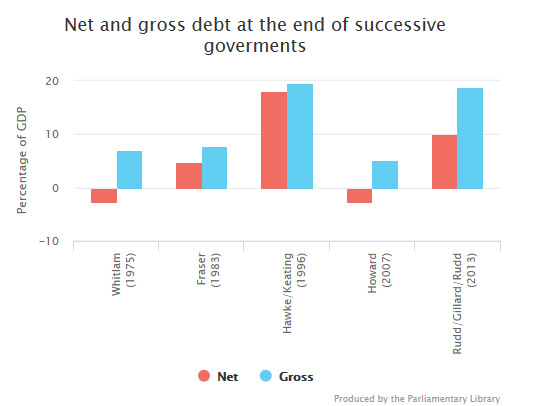
Sources: Gross debt- 1971-1995: RBA Occ Paper no. 8 Historical stats - Commonwealth Government Securities on Issue, 1995-2000: RBA table e10 - Commonwealth Government Securities on Issue, 2001-2013: Budget final outcome, Commonwealth Securities on Issue, 2014-2017: 2013-14 Mid-Year Economic and Fiscal Outlook - Commonwealth Government Securities on Issue (estimated/projected), 1971-2012: ABS, Annual National Accounts, cat.no. 5204.0 Table 2, 2014-2017: Mid-Year Economic and Fiscal Outlook (estimated/projected nominal GDP growth rates applied). Net debt- 2013-14 Mid Year Economic and Fiscal Outlook.
In gross and net terms the Rudd/Gillard/Rudd Labor government recorded the second largest debt position of all previous governments over the reporting period with only the Hawke/Keating Labor government experiencing a higher debt position.
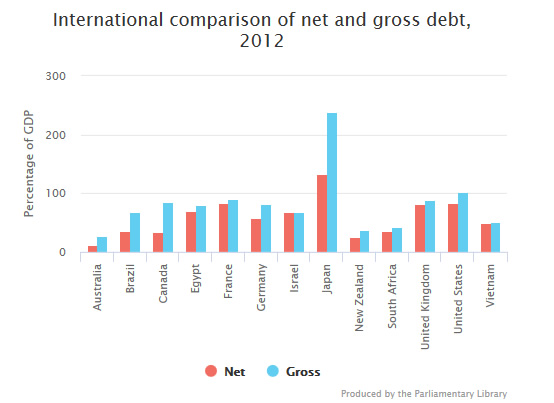
Chart 4 presents general government gross and net debt for Australia in 2012 compared with other countries. The term general government used here is from the International Monetary Fund and is defined as all entities that fulfil the function of the government as their primary activity. Chart 4 clearly shows that Australia’s general government gross and net debt, which currently stands at 27.9 and 11.9 per cent of GDP respectively, is much lower than those of a range of other countries.
Alan Payne, with assistance from Alicia Hall and Toby Bellwood
Senior Researchers, Statistics and Mapping Section, Parliamentary Library