The awarding of the 2011 Nobel Prize for Physics to Professor Brian Schmidt, an Australian National University (ANU) professor of Astrophysics, for his role in the discovery that the universe is expanding at an accelerating rate, is a significant achievement not only for ANU but also for Australia. It is the first time in almost one hundred years that an Australian has won a Nobel Prize in Physics – William and Lawrence Bragg, a father and son team, were the last Australians to win a Nobel Prize for Physics in 1915 – and it is the sixth Nobel Prize to be won by an ANU researcher.
In light of this great achievement, it is pertinent to ask about the broader state of health of Australian science as measured by its funding. How much goes to science research and development (R&D) and is this level of funding adequate? This article will not address the question of adequacy of the current levels of R&D science funding, but instead examines Australia’s current and past R&D science expenditure, and what sectors of the economy provide the funding.
The total expenditure on all research and development in 2008–09 was approximately $27.7 billion. This includes expenditure from the following sectors: Business, Government (Commonwealth, State and Territory), Higher Education and Private not for Profit Organisations (PNFPO).* The Business sector accounted for 61 per cent of total expenditure. Expenditure on the sciences, which includes Psychology and the Cognitive Sciences but excludes expenditure from PNFPO, accounted for 92.1 per cent of the total. Expenditure in the physical sciences in 2008–09 was approximately 455 million, of which 436 million can be attributed to the public sector (higher education and all levels of government).
The total expenditure in 2008–09 was distributed to the following types of R&D activities:
- Pure basic research – $2.5 billion
- Strategic basic research –$3.4 billion
- Applied research – $10.6 billion
- Experimental development –$11.5 billion
Total expenditure, in real terms, from 1992–93 to 2000–01 remained relatively constant, however, since 2000–01 total expenditure for business and the public sector has increased at an increasing rate. This is clearly shown in Chart 1.

Total expenditure as a proportion of gross domestic product (GDP) in 2008–09 was 2.21 per cent. When compared to other Organisation of Economic Co-operation and Development (OECD) countries, Australia is below the OECD average, which, in 2008–09 was 2.33 per cent. Despite this, Australia’s contribution as a per cent of GDP grew from 2000–01 to 2008–09 by 0.70 percentage points as opposed to 0.10 percentage points for the OECD average. Australia spent more as a proportion of GDP than the United Kingdom, Canada and France who spent, respectively, 1.77, 1.84 and 2.02 per cent, but less than the United States and Germany (2.77 and 2.64 per cent respectively).
There has been a significant increase in expenditure on R&D by the Business sector since 2000–01, with the exception of 2009–10 where expenditure decreased, in real terms, by 5 per cent when compared to 2008–09. The increased expenditure was most probably connected to the resources sector boom – Manufacturing and Mining, the largest contributor to total Business sector expenditure, accounted for 51 per cent and 47 per cent of the total Business expenditure in 2008–09 and 2009–10 respectively.** The decrease in Business expenditure in 2009–10 would, in part, be as a consequence of the global financial crisis.
The decrease in total Business expenditure on R&D in 2009–10 was also reflected in the total of Business expenditure as a proportion of GDP. In 2009–10, Business expenditure on R&D represented 1.3 per cent of GDP, down 0.08 per cent when compared to 2008–09. In 2008–09, the Australian Business sector, compared to other OECD countries, spent more on a per GDP basis than the United Kingdom and Canada, 1.10 and 0.99 per cent of GDP respectively, but less than the United States of America, Germany, France and the OECD average, 2.02, 1.86, 1.32 and 1.62 per cent of GDP respectively.
Chart 2 presents the sources of funding for the total expenditures from 1992–93 to 2008–09, in real terms. In 2008–09 Business and All other sectors combined funded $584.4 million worth of R&D that was actually performed by the Commonwealth government. This sum includes higher education funding. Combining higher education and Commonwealth funding is a reasonable assumption because most of the funds for higher education are derived from the Commonwealth. Conversely, all other sectors apart from Business contributed, in 2008–09, $68.3 million to the Business sector.
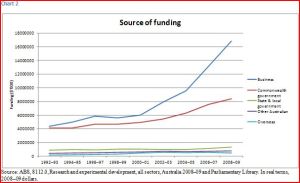
Although the level of Commonwealth funding is less than Business funding it is the second largest contributor to total funding and has increased considerably since 2000–01. The increased funding in 2008–09 by the Commonwealth, although not as large as the increase in Business funding – approximately 180 per cent increase between 2000–01 and 2008–09 – represents an overall increase of 71 per cent when compared to 2000–01.
It is very clear that the total expenditure and total funding for R&D is increasing from most sectors of the economy. Although Australia’s expenditure on R&D, as a proportion of GDP, remains below the OECD average, the growth over the last 10 years is closing this gap. Even if these trends do not result in any more Nobel Prizes for Australian researchers, they should go a long way towards helping innovation in science and technology in Australia.
*ABS, 8112.0, Research and experimental development, all sectors, Australia 2008–09
**ABS, 8104.0, Research and experimental development, Businesses, Australia 2008–09